
Fig. 7.
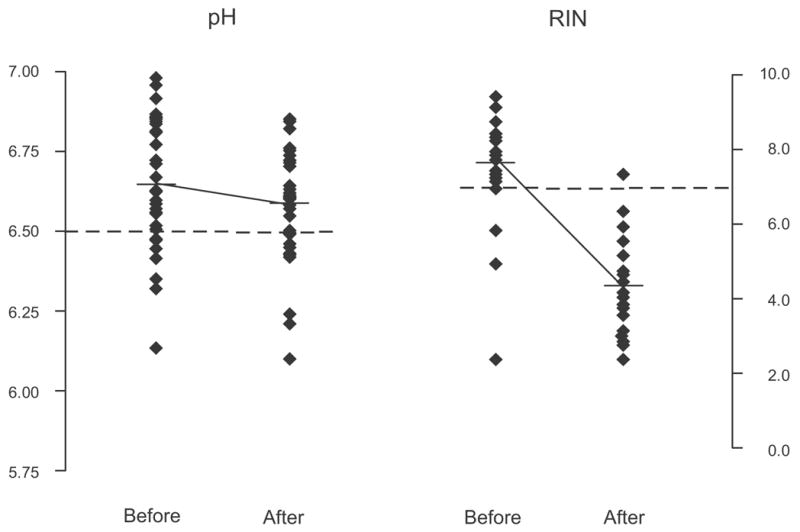
Scatterplot diagram of the pH and RIN distribution before and after the thaw. The dotted lines represent a pH value of 6.5 (our threshold for good versus low quality tissue) and a RIN value of 7 (our threshold for good versus low quality tissue). As results from the graph, most of the RIN values after the thaw are below 7.