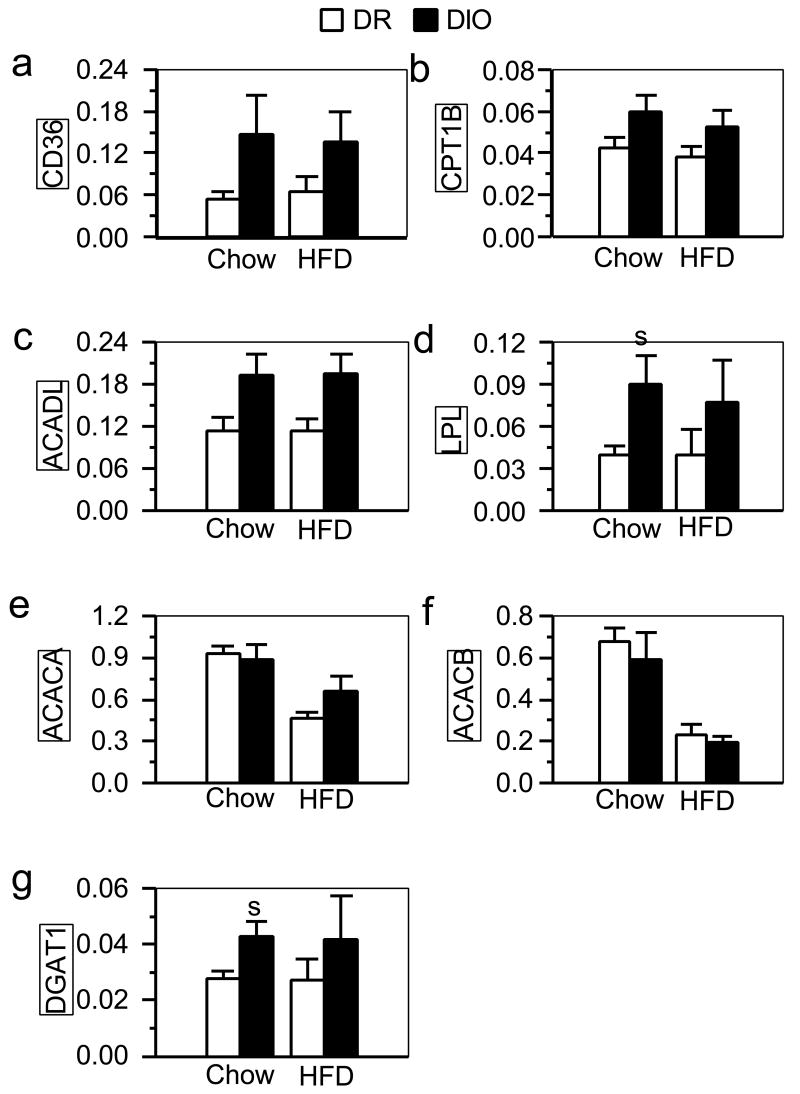
Fig. 3.
mRNA levels of CD36(a), CPT1B (b), ACADL (c), LPL (d), ACACA (e), ACACB (f), and DGAT1 (g) quantified by real-time RT-PCR in muscle samples from DIO and DR rats fed low-fat chow (Ns = 5) or a high-fat diet (HFD; Ns = 6; the same rats as in Fig. 1a). Values (mean ± sem) were normalized against the level of glyceraldehyde-3-phosphate dehydrogenase (GAPDH) mRNA expression in each sample. s: significant strain difference (P ≤ 0.05) between DR and DIO rats fed the same diet.

