
Fig. 3.
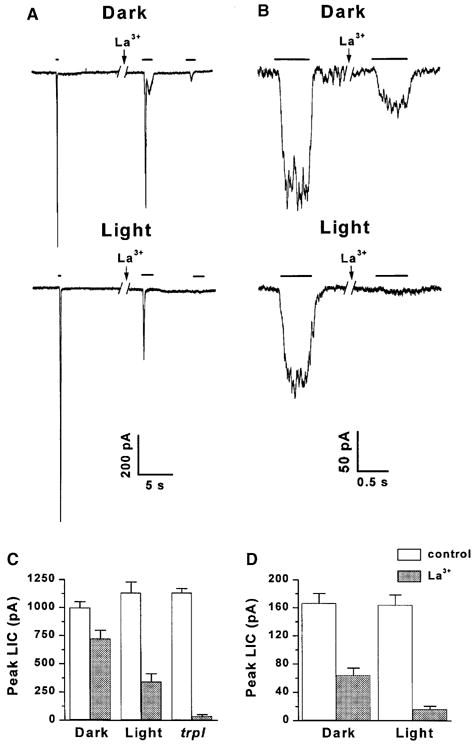
Differential block of the LIC by La3+ in light- and dark-raised wild-type flies and in the trpl mutant. (A) Responses to relatively intense lights of wild-type Drosophila cells of flies raised in light or darkness (as indicated) during whole cell recordings at a holding potential of −60 mV. Cells were stimulated by constant white light, of durations indicated by bars, attenuated by 3.6 or 2.5 log units for dark- and light-raised flies, respectively. The left LIC are control responses. Application of La3+ (10 μM) to the bath (as indicated by arrow) led to a reduction in peak amplitude and suppression of the response to a second light pulse, typical for the trp mutant. The break in the traces indicates a time of 2 min. (B) Responses to relatively dim lights (orange lights, attenuated by 2.8–3.3 log units) in a paradigm similar to that of Fig. 3A, except that 0.5 mM external Ca2+ was used and the La3+ concentration was 20 μM. The effective intensity of the orange light was ~100 fold dimmer than the white light used in A. (C) Histogram plotting the peak amplitudes of the LIC of Fig. 3A, in response to the constant light before (control) and after application of La3+ in dark- and light-raised wild-type flies and in the trpl mutant (as indicated). The error bars are SEM calculated from 6–8 cells for each group. (D) Histogram plotting the peak amplitudes of the LIC of Fig. 3B in response to the dim test light before (control) and after application of La3+ in dark- and light-raised flies. The error bars are SEM calculated from 5 cells for each group. (From Bähner et al., 2002.)