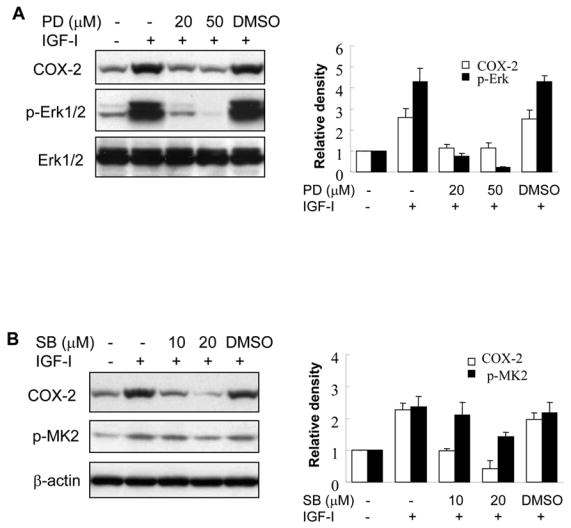
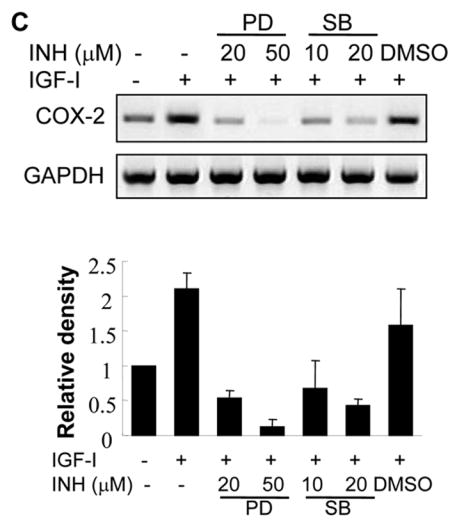
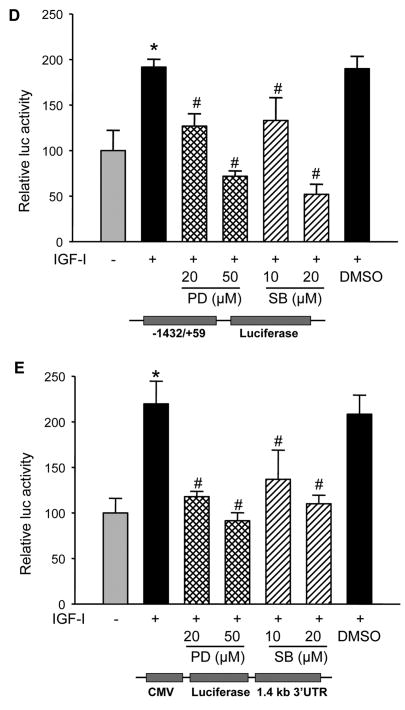
Fig. 5. IGF-I-induced COX-2 expression is dependent on MAPK activation.


(A and B) A2780 cells were pretreated with the solvent (-), PD98059 (PD) or SB203580 (SB) for 1 h, then treated with 200 ng/ml IGF-I for 8 h. Specific protein levels were analyzed by immunoblotting using antibodies against COX-2, phospho-Erk1/2 (p-Erk1/2, Thr202/Tyr204), total Erk1/2, phospho-MK2 (p-MK2, Thr33), and β–actin, respectively. The right panels indicated the mean ± SD of the corresponding densitometry data from duplicate experiments. (C) The cells were pretreated with PD, SB, or DMSO for 1 h, followed by incubation with 200 ng/ml IGF-I for 6 h. COX-2 and GAPDH mRNA levels were analyzed by RT-PCR. The lower panel indicated the mean ± SD of the corresponding densitometry data from duplicate experiments. (D and E) The cells were transfected with phPHES2(−1432/+59) and Luc-3′UTR plasmids, respectively; and cultured overnight. The cells were switched to serum-free mdium, and incubated in the absence or presence of DMSO, PD, or SB with 200 ng/ml IGF-I as indicated for 16 h. Relative luciferase activity was analyzed as described in Fig. 3. Data are mean ± SD from five independent experiments. * indicates that the value is significantly different when compared to that of the control (p<0.05); # indicates that the value is significantly different when compared to that of IGF-I treatment alone (p<0.05).

