
Fig. 1.
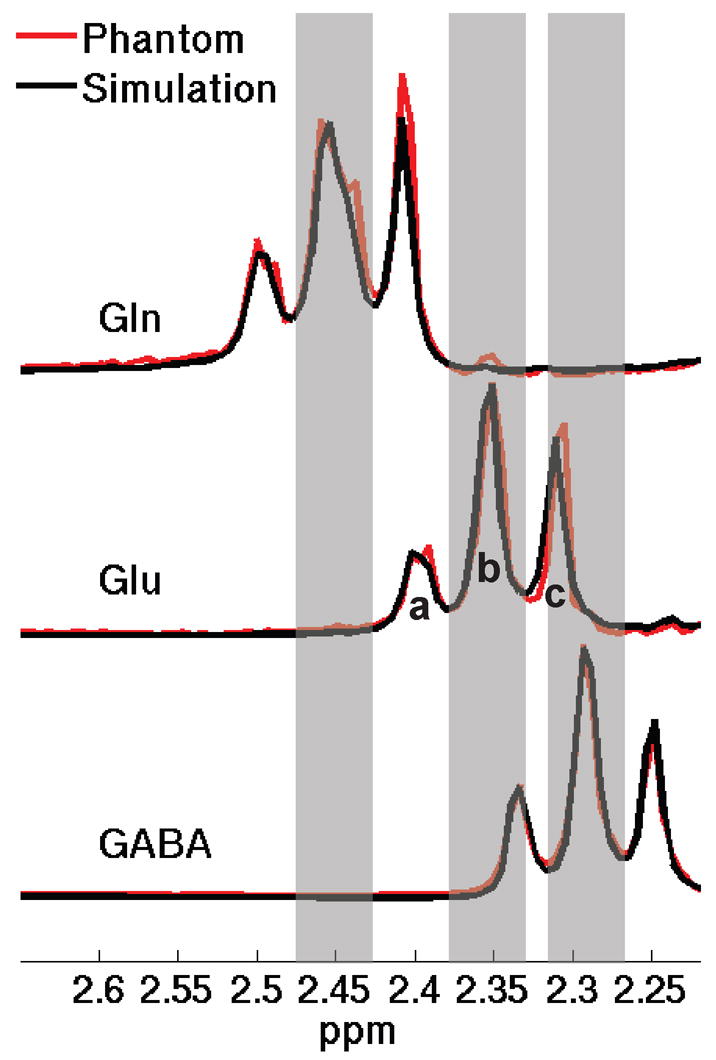
Simulated STEAM spectra (black line) of Gln, Glu, and GABA and their corresponding in vitro spectra (red line) at short-echo parameters of TE = 10 ms/TM = 10 ms. For simplicity, only the spectra in the 2.2-2.7 ppm region are shown. The shaded bars represent the spectral regions of central peaks of the Gln C4 pseudo-triplet resonance around 2.45 ppm, the Glu C4 pseudo-triplet resonance around 2.35 ppm, and the GABA C2 triplet resonance around 2.28 ppm, respectively. In the schematic diagram, a and c represent the outer-wings of a pseudo-triplet and b the central peak (for simplicity, only shown in the Glu spectrum).