
Fig. 3.
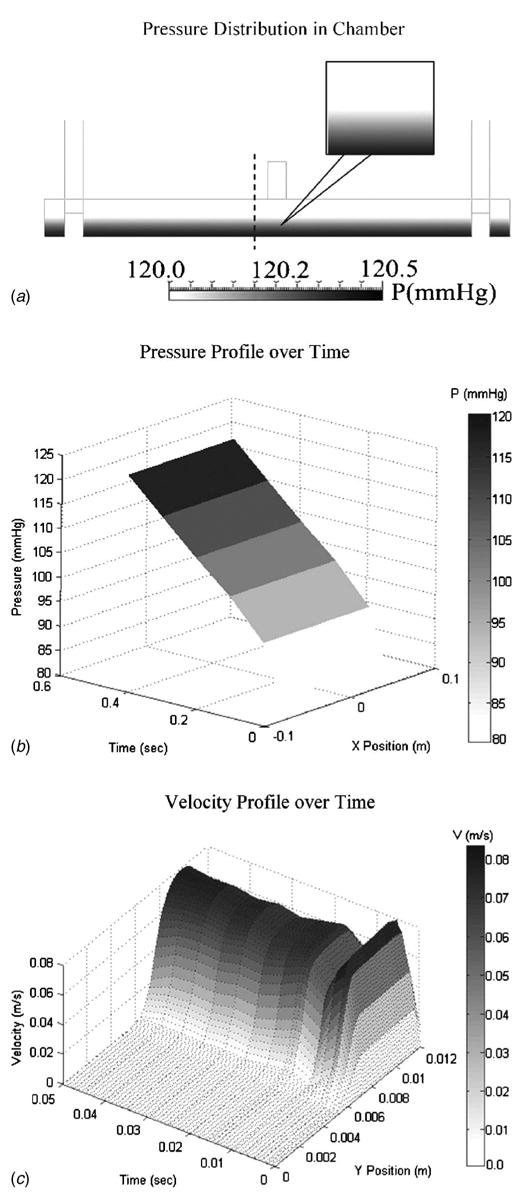
(a) Results for CFD analysis revealing a uniform pressure distribution across the length of the chamber. The dashed line indicates the position from which the velocity profile (c) was extracted. (b) Results for the pressure versus time versus position across the bottom of the cyclic pressure chamber indicate a smooth, continuous increase in pressure over the course of the simulation and along the length of the chamber. (c) A three-dimensional spatial velocity profile over time shows the development of parabolic flow in the air space, and that the velocity is zero in the liquid space (air-liquid interface located at y=6.3 mm).