
Fig. 4.
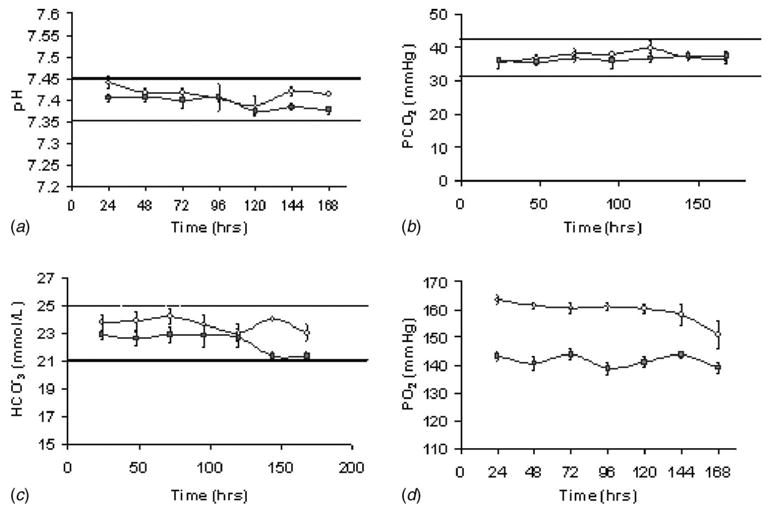
Automated blood lab readings demonstrate similar values between the cyclic pressure (○) and control experiments (▪) for (a) pH, (b) pCO2, and (c) HCO3−. (n=8). Dashed lines indicate the upper and lower limits for acceptable values for each measured variable. The stability in the HCO3− values indicates sufficient humidification. (d) pO2 values for pressure were elevated over controls throughout the experiments due to the increase in ambient pressure. These values, although statistically different (p<0.05), had similar FiO2 values when adjusted for ambient pressure and are not considered biologically significant.