
Figure 3. MRI Signal Characteristics in Control and Trauma Groups.
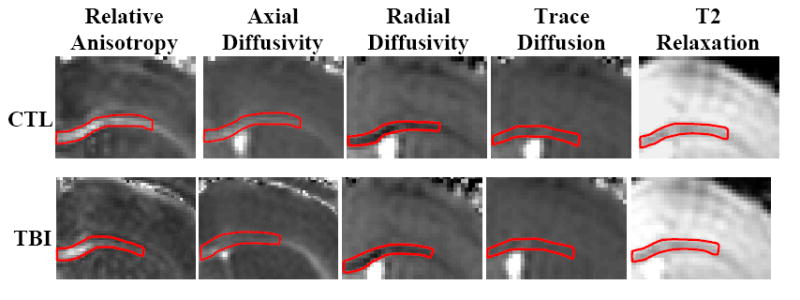
Grey scale images of signal intensity: lighter shading indicates elevated signal (i.e. increased anisotropy, greater diffusivity, or longer relaxation time). The region of interest in each panel is outlined in red. Relative anisotropy and axial diffusivity show a gradient of signal changes within the ROI on post-TBI images. Radial diffusivity, trace, and T2 images show homogeneous signal throughout the region of interest that is similar to that of the control images. Examples shown for illustrative purposes, not necessarily from the same mouse. (Bregma +0.26 mm, Franklin 1997)