
Figure 4. Quantitative Analysis of MR Imaging Parameters.
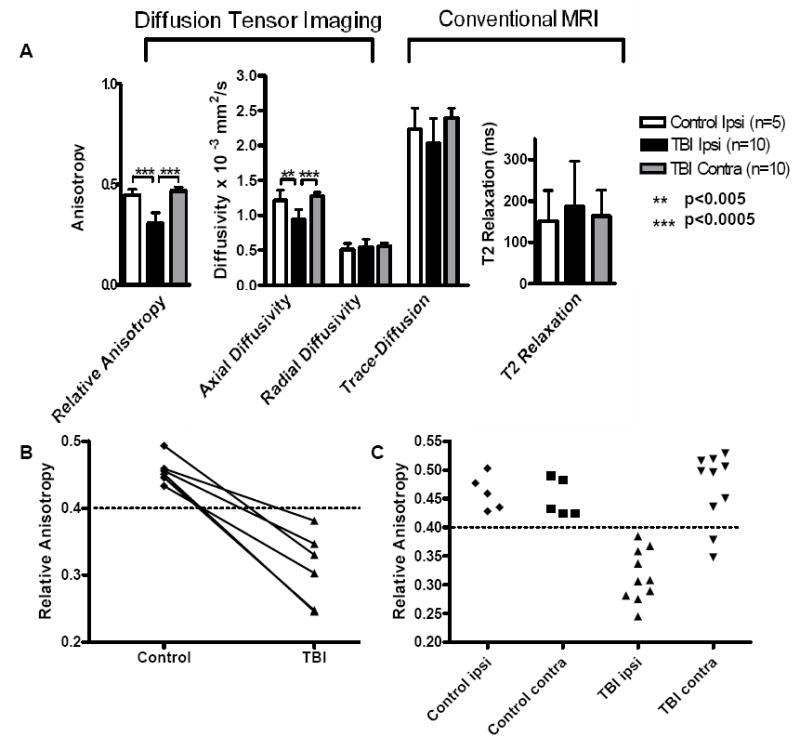
(A) Average values for DTI and conventional MRI parameters within the region of interest encompassing injured white matter in corpus callosum and external capsule. Differences between ipsilateral TBI and ipsilateral control for relative anisotropy (RA) and axial diffusivity (AD) were statistically significant (p=0.00001 RA, p=0.005 AD, one-sided, paired T-tests) whereas there were no difference for radial diffusivity (RD) (p=0.874), DWI-trace (p=0.273), and T2 relaxation (p=0.797). Differences between the ipsilateral and contralateral sides of the TBI groups were also significant for RA (p=0.00002) and AD (p=0.000035). Error bars denote standard deviations. (B) Graph of RA values acquired for mice scanned before and after TBI. There was a decreasing trend in RA for each mouse postinjury. (C) Scatter plots of RA values from each mouse. There was no overlap of RA values between injured and control ROI’s ipsilateral to the injury. No differences between ipsilateral and contralateral values were seen in controls. RA in the contralateral ROI’s after TBI overall was similar to control, with the exception of data from 2 mice. Upon histological re-examination these two brains were found to have some contralateral axonal injury.