
Figure 5. Quantitative Relationship Between DTI Signal Changes and Histologically Defined Axonal Injury Severity.
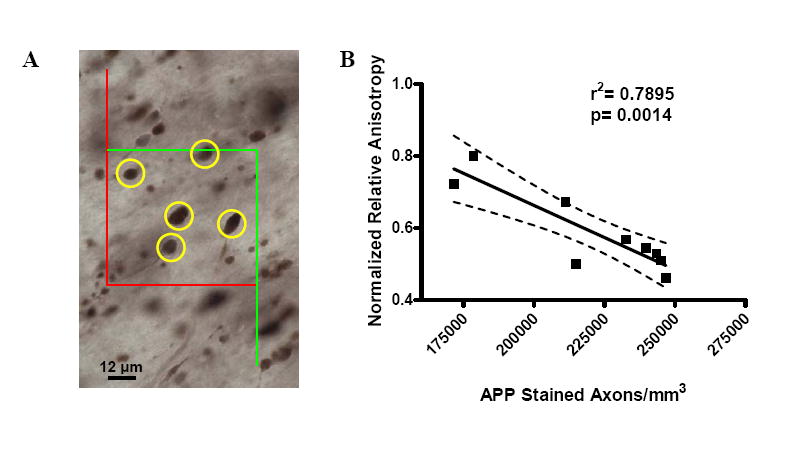
(A). Counting frame used for stereological estimation of the numbers of APP stained, injured axons. APP stained axonal varicosities (marked in yellow) within the computer-generated, systematic random sampling zones were counted. Positively stained injured axonal varicosities were not counted if they touched the red boundary and were counted if they were centered within the green boundary. Faintly stained punctae less than 8 μm in diameter were not counted. (B) Correlation of normalized relative anisotropy with the estimated numbers of APP-stained, injured axons per mm3. Each symbol represents 1 mouse. The values of RA acquired following trauma were normalized by dividing by the mean ipsilateral RA value acquired during the control scans. Estimates of the number of APP-stained axons per mm3 were obtained by dividing the total number of counted APP-stained axonal varicosities by the total volume of the counted sampling zones. A strong correlation was found between the change in relative anisotropy and the severity of axonal injury as defined by APP immunostaining. Dashed lines represent the 95% confidence band.