
Figure 7. Quantitative Analysis of the Spatial Gradients of Relative Anisotropy Signal Changes and Histologically-Defined Axonal Injury.
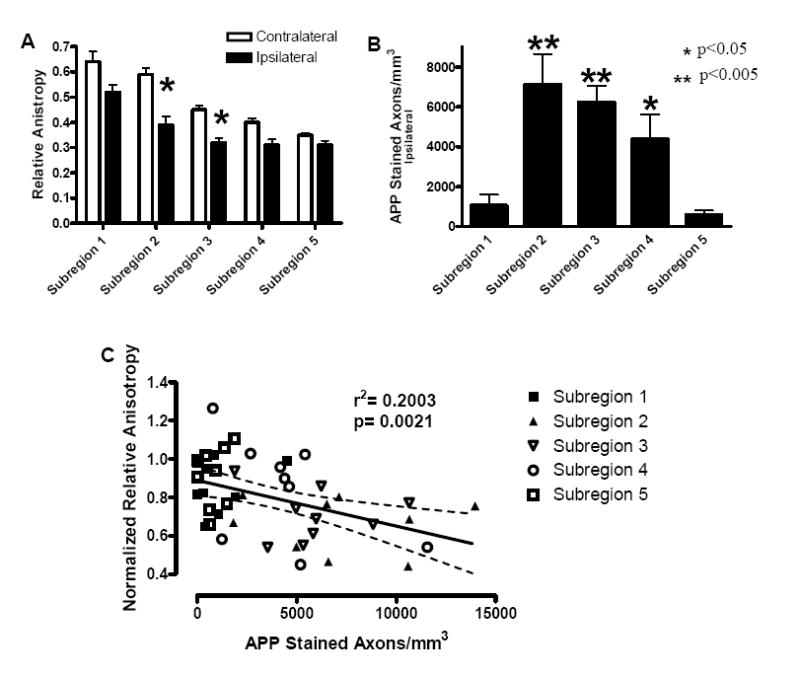
(A) Relative anisotropy as a function of subregions, as defined in Figure 6. There was a significant reduction in relative anisotropy ipsilaterally in subregions two and three when compared to the contralateral subregions (student’s t-test, p<0.05). (B) Number of APP stained axons per mm3 on the ipsilateral side as a function of subregion. There were significant differences between subregions, specifically; subregions two, three, and four were found to be significantly different than subregions one and five (p<0.05) (one-way ANOVA p=0.00008, F4,40=7.97 followed by Fisher post-hoc analysis). (C) Correlation between normalized relative anisotropy and numbers of APP stained axons per mm3 was significant (p=0.0021). Dashed lines represent 95% confidence band.