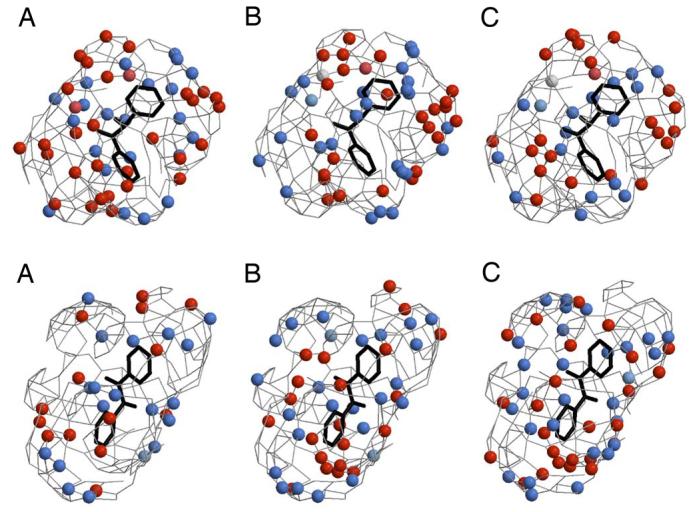
Figure 3.
3D-QSAR pseudoreceptor models for the inhibition of CEs by the fluorobenzoins (upper panel) and the fluorobenzils (lower panel). In each case, the models for hiCE (A), hCE1 (B), and rCE (C) are shown as colored spheres on a hydrophobic gray grid. Areas that are hydrophobic are indicated in gray, with blue spheres representing regions that are positively charged and hydrophobic (+0.1e), and light blue spheres corresponding to hydrogen bond donors. Orange spheres indicate hydrogen bond acceptors and orange-red spheres correspond to areas that are negatively charged and hydrophobic (−0.1e). The structure of benzil or benzoin is shown in black. The figure was created using Raster3D and Molscript32.

