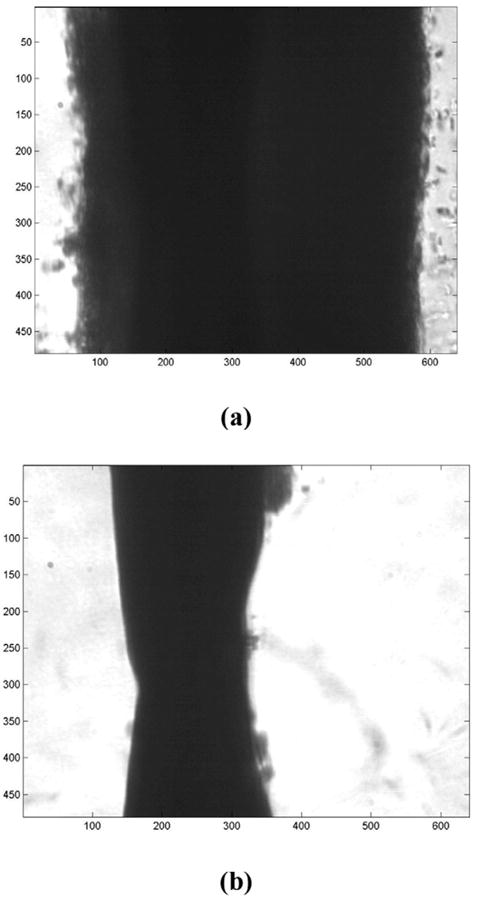
Fig. 5.

Photomicrograph of a human whole blood clot. (a) The clot is shown after 1 min of exposure to rt-PA and 120 kHz ultrasound treatment with a duty cycle equal to 50%. As in Fig. 3, the numbers along the x and z axes denote pixel number and one pixel is roughly equivalent to 0.5 μm. Note that the plasma-clot interfaces are well-defined. (b) The clot is shown after 7 min of exposure. Substantial thrombolysis has occurred, and the clot is mostly degraded. Note the degradation products evident in the plasma.
