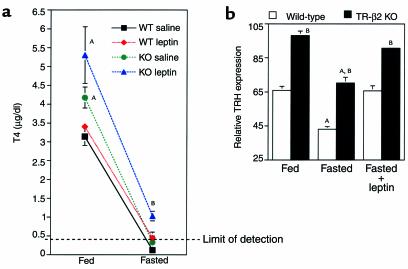
Figure 5.
Thyroid hormone and TRH responses to fasting and leptin administration. (a) Fed and fasting T4 concentrations in WT (black and red symbols) and TR-β2–null (KO) mice (green and blue symbols). n = 4 for all groups, except for saline-treated KO mice (n = 3). Data are mean ± SEM. AP < 0.05 versus fed WT; BP < 0.05 versus all other fasted mice by ANOVA. (b) Relative prepro-TRH expression as assessed by laser densitometry in the rostral PVN of WT (open bars) and TR-β2 KO mice (filled bars) at base line and after a 48- hour fast with and without leptin administration. Data shown are mean ± SEM. Each point represents analysis of anatomically identical sections. n = 3 fed groups, n = 3 fasted KO, n = 4 all other groups. AP < 0.05 versus fed or fasted plus leptin groups of same genotype, respectively. BP < 0.05 versus WT in the same treatment group by ANOVA.

