
Figure 9.
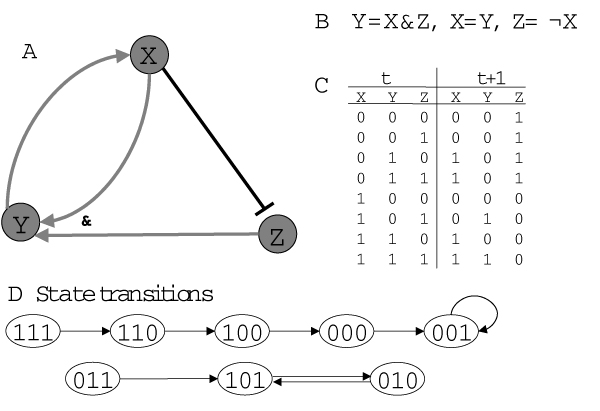
Example for a small Boolean network consisting of 3 genes X, Y, Z. There are different ways for representing the network: A as a graph, B Boolean rules for state transitions, C a complete table of all possible states before and after transition, or D as a graph representing the state transitions. Reproduced from [2].