
Figure 5.
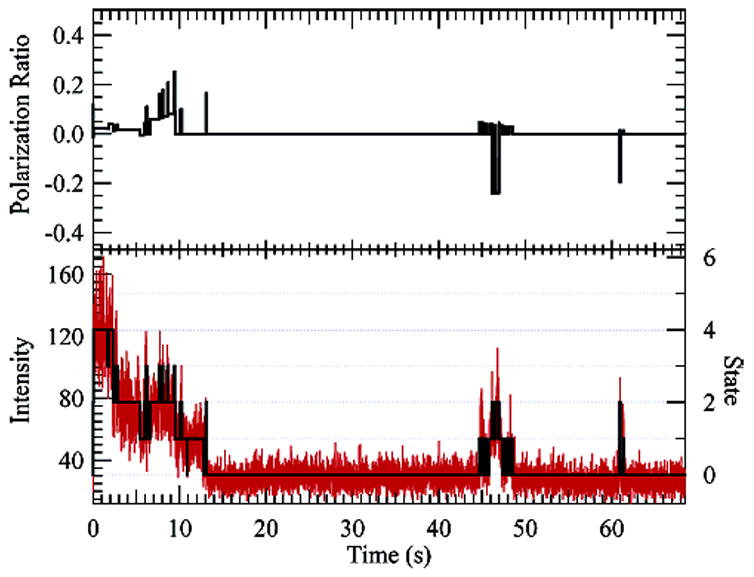
5.8 TMR-labeled (70 kD) dextran allowed to dry on a glass surface. Polarization effects can be seen in the upper graph, where the state-dependent polarization ratio is plotted (zero indicates isotropic emission). The bottom graph shows a histogram of the photon trajectory binned at 10 ms for the combined two-channel data. The five-state (four-dye) reconstruction is overlaid.