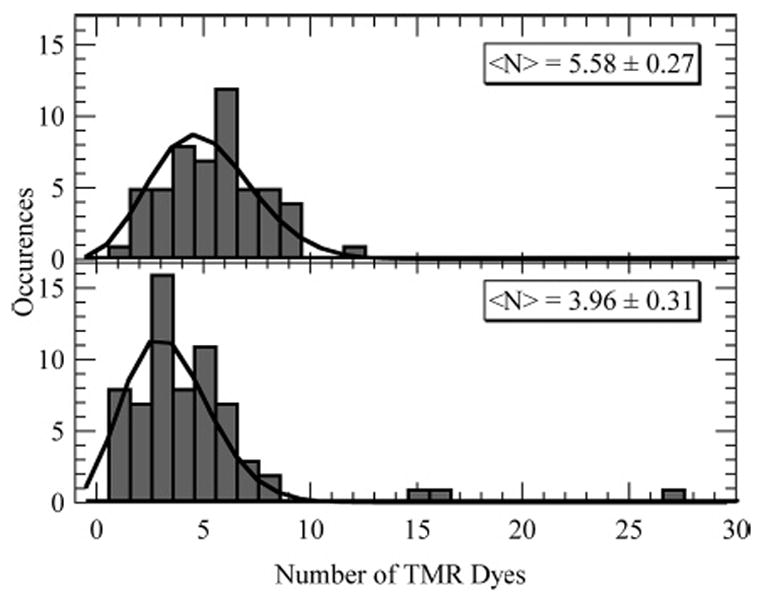
Figure 7.

Comparison of the number distribution of TMR dyes on two conjugates, 3.8 and 5.8 TMR dyes/mole of dextran. The solid curves are the result of a fit to the data with a zero-excluded Poisson distribution. The fitting resulted in distributions with centers at 3.96 ± 0.31 and 5.58 ± 0.27 dyes.
