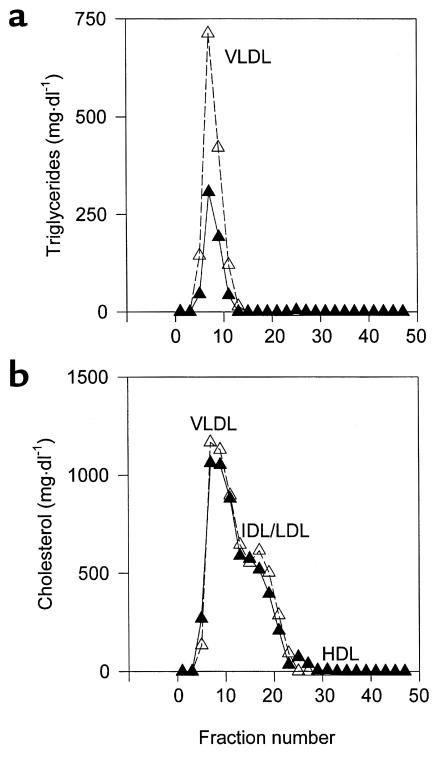
Figure 3.
High-resolution size-exclusion chromatography profile of serum triglycerides (a) and cholesterol (b) from PPARα–/–apoE–/– mice (open symbols, broken line) and PPARα+/+apoE–/– littermates (filled symbols, solid line). Serum samples from eight males of each genotype eating a Western-type diet for 6 weeks were pooled, separated by chromatography, and individual fractions were assayed for lipid content. The profile is representative of four independent lipoprotein profile comparisons performed in different cohorts of mice.

