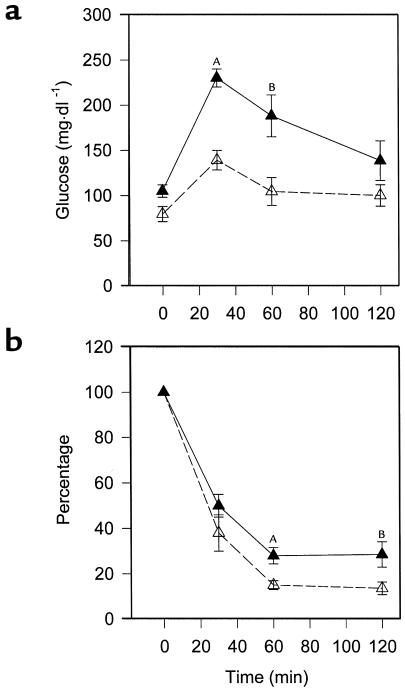
Figure 8.
Enhanced glucose tolerance and insulin responsiveness in PPARα-deficient mice. Mice were started on a Western diet at the age of 8 weeks and studied 4 weeks later. (a) Animals were injected with 1 g D-glucose/kg body weight, then tail-vein blood glucose was assayed at various times. AP = 0.0003 vs. PPARα–/–apoE–/–; BP = 0.0162 vs. PPARα–/–apoE–/–; n = 5 for each genotype. (b) Mice were injected with 0.75 U insulin/kg body weight, then tail vein blood was obtained. PPARα+/+apoE-/- animals are represented by filled symbols and PPARα-/-apoE-/- by open symbols. AP = 0.0124 vs. PPARα–/–apoE–/–; BP = 0.0435 vs. PPARα–/–apoE–/–; n = 8 for each genotype.

