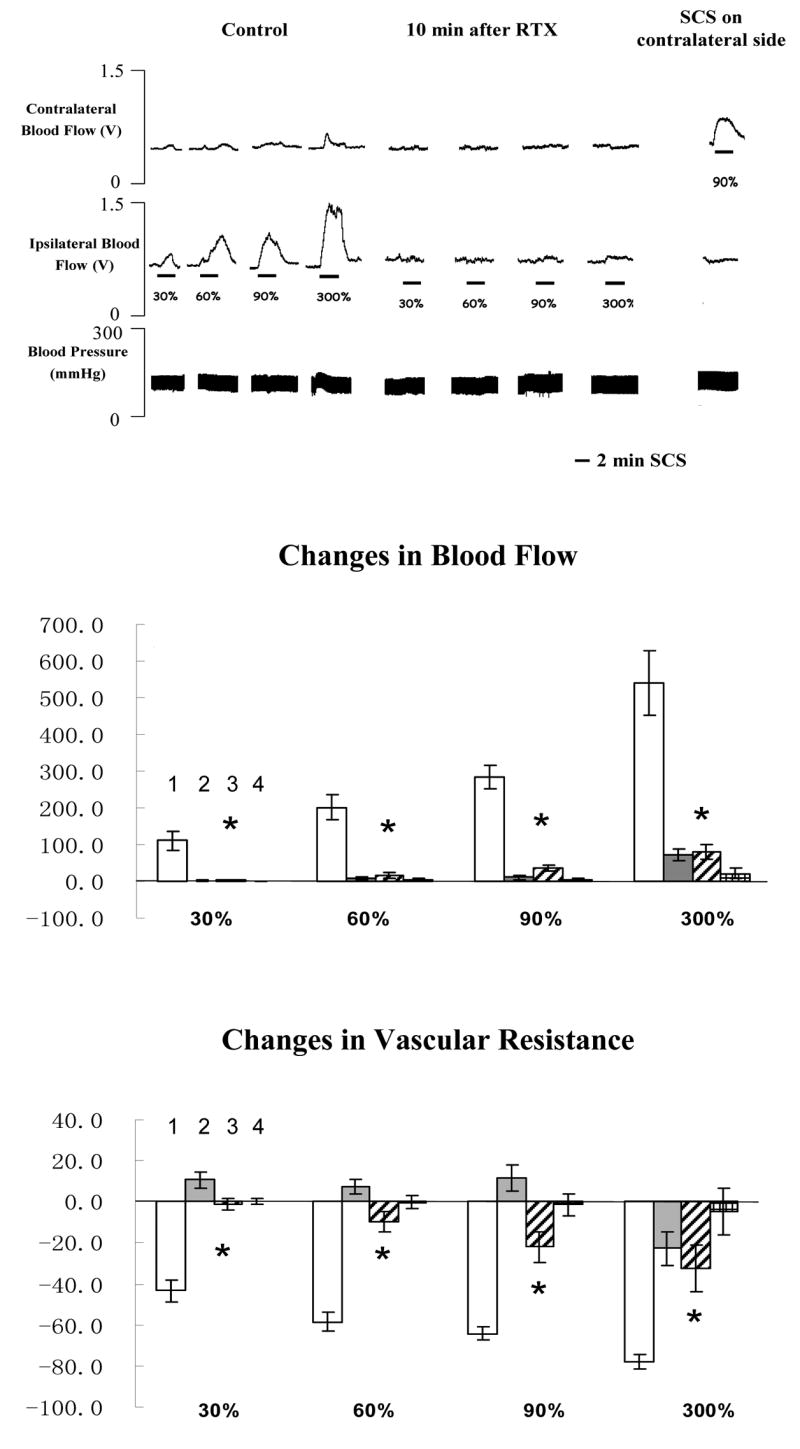
Fig 2. Changes of blood flow and vascular resistance produced by SCS before and after paw injections of RTX.

The top panel shows a representative example of ipsilateral and contralateral changes in blood flow and arterial blood pressure during SCS at different intensities, before and after RTX (100 μl saline containing 0.2 μg RTX, 0.1 μl 95% ethanol and 0.1 μl tween 80). The middle panel shows the percent changes of blood flow in the ipsilateral and contralateral hindpaws in response to 2-min SCS. (Column 1: changes in ipsilateral blood flow before RTX; Column 2: changes in contralateral blood flow before RTX; Column 3: changes in ipsilateral blood flow after RTX; Column 4: changes in contralateral blood flow after RTX). Each data point represents mean ± S.E.M (n=7). * P<0.05, compared to changes in ipsilateral blood flow during SCS before RTX. The bottom panel shows the percent changes of vascular resistance in the ipsilateral and contralateral hindpaws in response to 2-min SCS. (Column 1: changes in ipsilateral vascular resistance before RTX; Column 2: changes in contralateral vascular resistance before RTX; Column 3: changes in ipsilateral vascular resistance after RTX; Column 4: changes in contralateral vascular resistance after RTX). * P<0.05, compared to ipsilateral vascular resistance during SCS before RTX.
