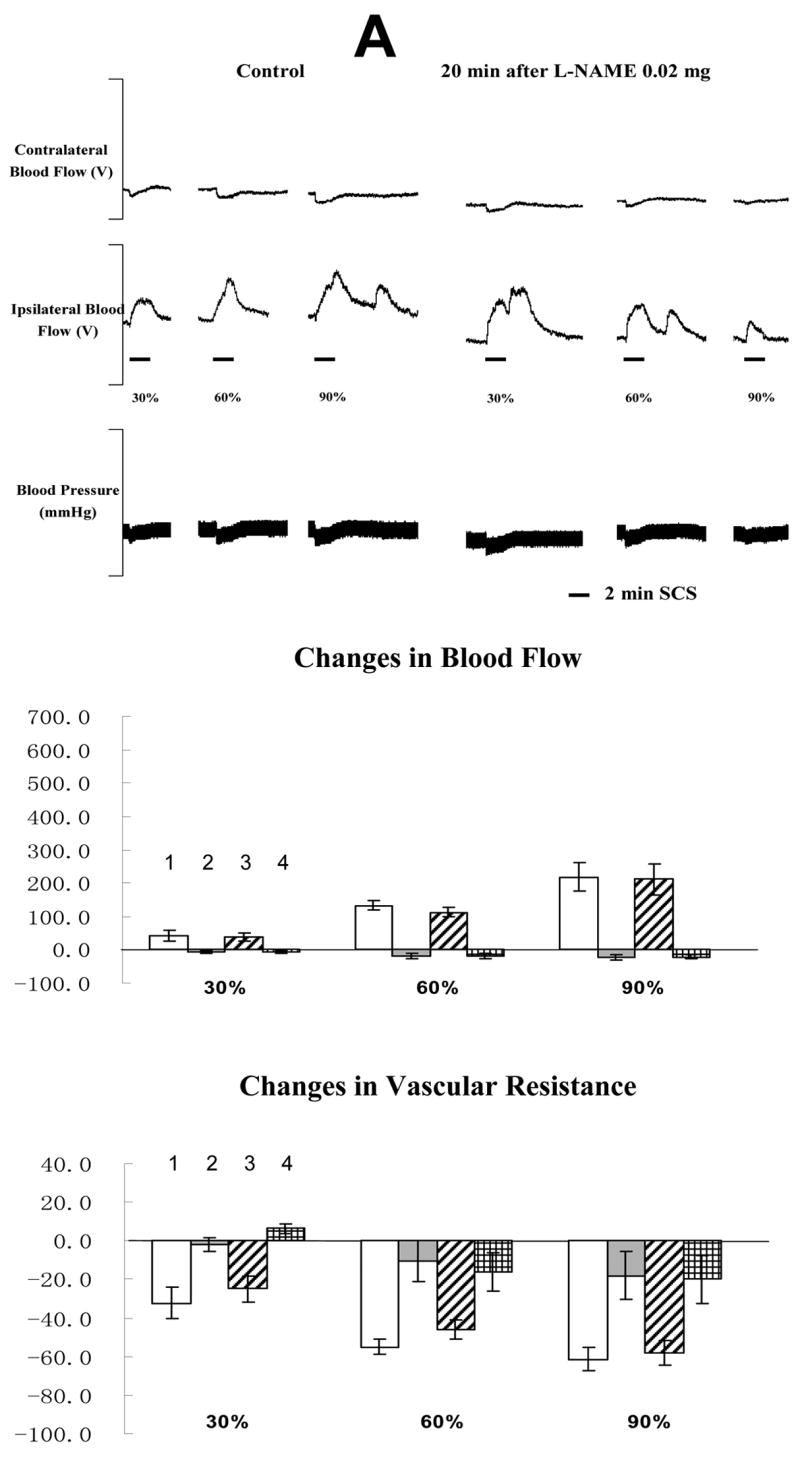
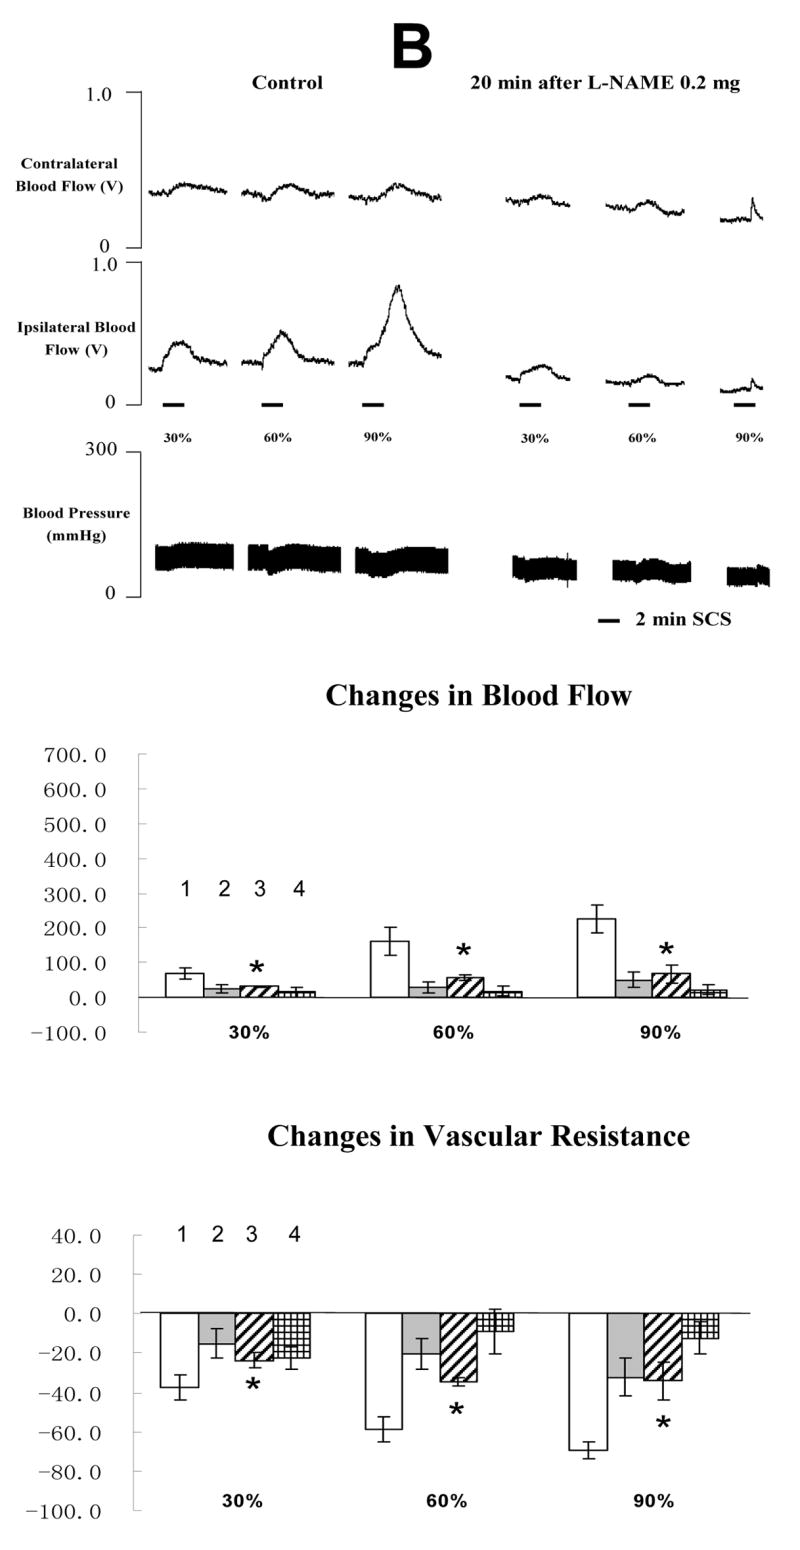
Fig 5. Changes of blood flow and vascular resistance produced by SCS before and after L-NAME. (A) L-NAME at 0.02 mg/100μl saline.


The top panel shows a representative example of ipsilateral and contralateral changes in blood flow and arterial blood pressure during SCS at different intensities, before and after neuronal NOS blocker at 0.02 mg/100 μl saline. The middle panel shows the percent changes of blood flow in the ipsilateral and contralateral hindpaws in response to 2-min SCS. Each data point represents mean ± S.E.M (n=5). The bottom panel shows the percent changes of vascular resistance in the ipsilateral and contralateral hindpaws in response to 2-min SCS. (B) L-NAME at 0.2 mg/100μl saline. The figure legends are the same as those in Fig 5 A. * P<0.05, compared to ipsilateral blood flow or ipsilateral vascular resistance during SCS before L-NAME at 0.2 mg/100 μl saline. The representations of columns are similar to Fig 2, except for the different names of chemical agents
