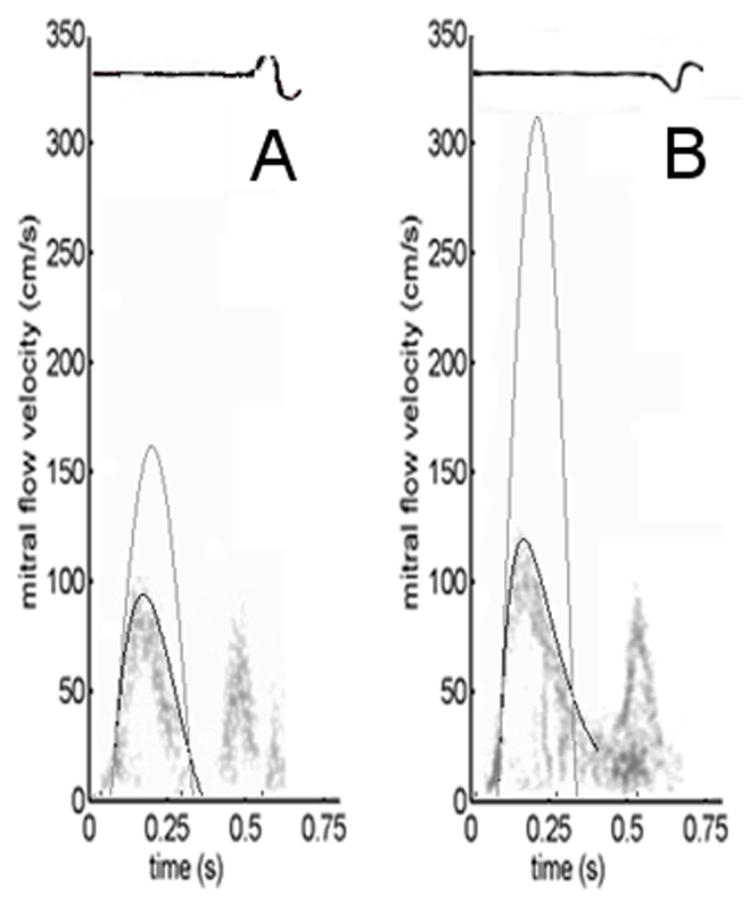
Figure 1.

Comparison of actual (c≠0) vs. idealized (c=0) E-waves for both a) non-diabetic and b) diabetic subjects (having similar chamber stiffness parameter k). The ratio of the VTIs (areas) of the respective actual (black) and idealized (gray) contours defines the kinematic filling efficiency index KFEI. a) Non-diabetic E-wave parameters: xo=−6.0 cm, k=244/s2, c=9.9/s. b) Diabetic E-wave parameters: xo=−20.3 cm, k=228/s2, c=27.7/s. The diabetic E-wave, with higher c, generates a visible inflection point in the deceleration portion (around 0.25 s in panel b). Note that stiffness parameter k remains indistinguishable between clinical and ideal contours. See text for details.
