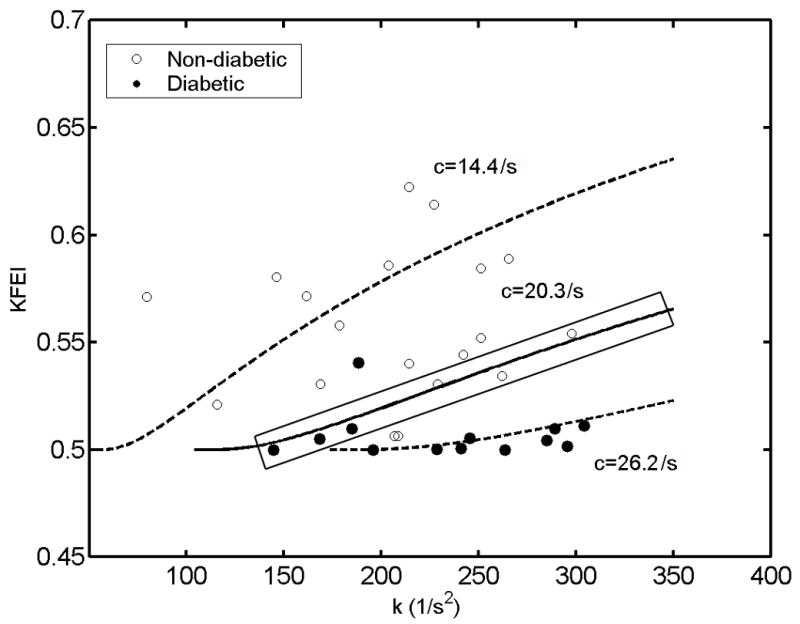
Figure 3.

The relation between KFEI and chamber stiffness (k) in the same subjects as in Figure 2, whose E-waves are fit by ‘underdamped’ kinematics (c2<4k) (19 non-diabetics = open circles, 13 diabetics = solid circles). Black circles denote non-diabetic subjects, solid circles denote diabetic subjects. Note tendency of solid circles to reside near the bottom of the figure. KFEI as a function of k, for three different, but constant, values of viscoelasticity/relaxation c are also shown (mean = 20.3/s solid; mean + 1SD = 26.2/s dashed, mean−1SD= 14.4/s dashed). Consider the 6 data points (3 solid circles, 3 open circles) closest to the solid line, e.g. 6 data points with c values very near c=20.3/s (within the black rectangle), Note k values for these 6 subjects are quite different, ranging from 150 (1/s2) to 300 (1/s2). This illustrates the effect of k on KFEI when c is essentially unchanged. For these 6 subjects c would not differentiate between the groups as well as KFEI. See text for details.
