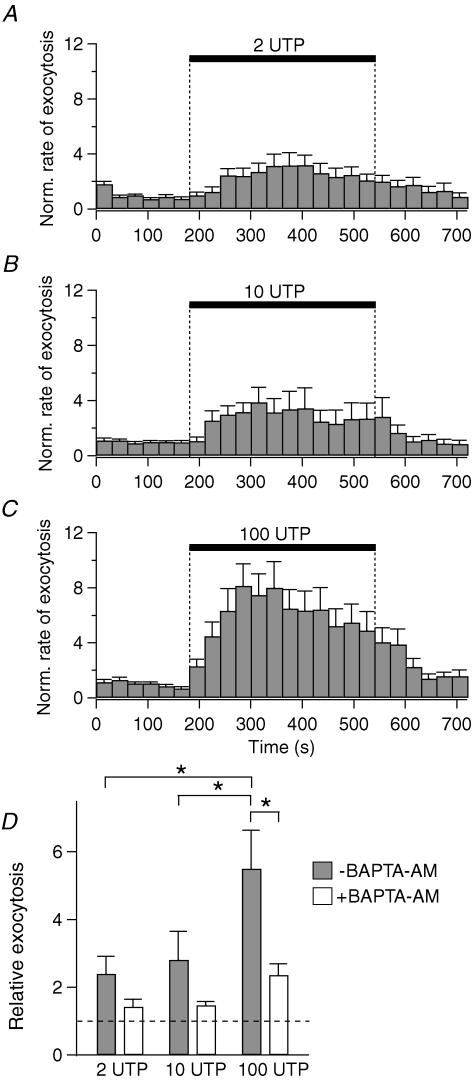
Figure 3. Concentration dependence of UTP-induced exocytosis.
A–C, normalized (Norm.) rate of exocytosis evoked by 2 (n = 13), 10 (n = 15) and 100 μm UTP (n = 22). Error bars are shown only in the upward direction. D, summary of relative exocytosis evoked in different conditions. White and grey bars indicate 20 μm BAPTA-AM treated and untreated groups, respectively. *P < 0.05, significantly different compared to 100 μm UTP response without BAPTA loading. The broken line in D denotes the value of the control without UTP.

