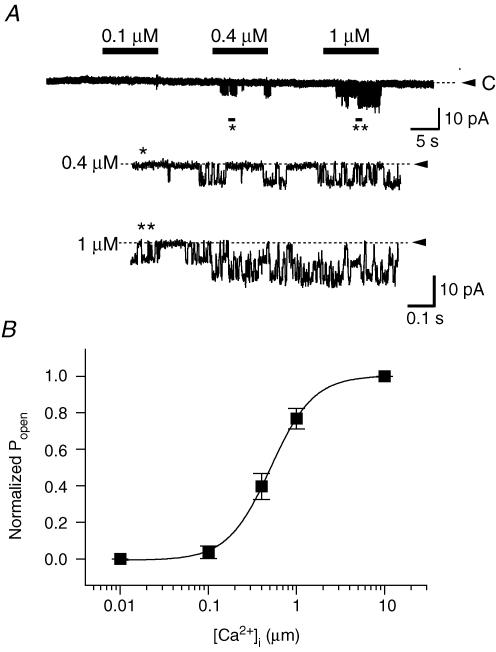
Figure 6. Single-channel recordings of Ca2+-activated K+ channels in PDEC.
A, channel activity recorded at different intracellular (bath) Ca2+ concentrations in an excised inside-out patch. Bars indicate application of Ca2+ in the bath solution. Between tests, the bath solution contained 5 mm EGTA without Ca2+. Patches were held at −100 mV with 120 mm K+ on both sides. Bottom panels represent expanded traces of the regions marked by asterisks. Dashed line and arrowhead denote the closed state of the channels. B, dose–response relation. Normalized Popen is plotted as a function of the Ca2+ concentration (2–7 patches for each point). The curve was obtained by fitting the data points with the Hill equation (see Data analysis).

