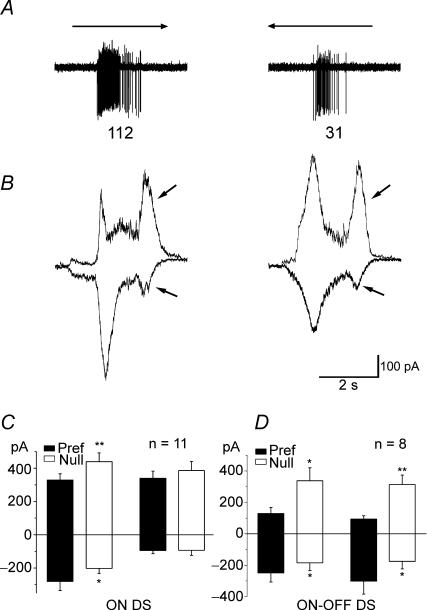
Figure 3. Synaptic inputs of the ON DSGCs.
A, spiking traces of an ON DSGC responding to a rectangle moving in the preferred and null directions. The number of spikes in the traces is marked below. B, excitatory and inhibitory inputs to the ON DSGCs revealed by holding the membrane potential at −65 and 0 mV, respectively. It is clear that this ON DSGC receives a larger EPSC when the rectangle moves in the preferred direction and a larger IPSC when the stimulus moves in the null direction. Arrows point to the late components, both excitatory and inhibitory. C, statistical data from 11 ON DSGCs. Excitatory inputs are plotted downward, inhibitory inputs upward. The differences between ON components are statistically significant (P < 0.05) for excitation, and for inhibition (P < 0.01, paired t test, mean ± s.e.m.). There is no statistically significant difference for the late components for either excitation or inhibition. D, averaged current responses of 8 ON–OFF DSGCs to a rectangle drifting at the same velocity (for comparison with the ON DS responses).

