Figure 10.

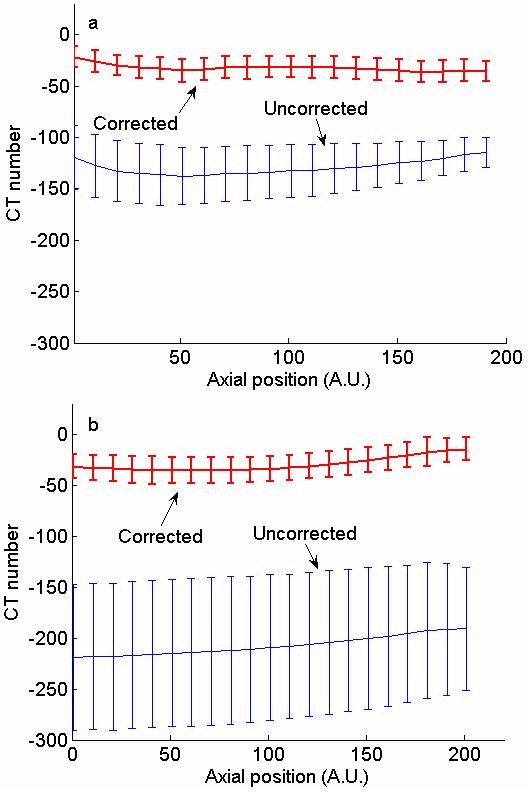
Means and standard deviations of adipose tissue CT numbers in axial slices of medium (a) and large size (b) specimens. Values are plotted as a function of position along the axial direction.

Means and standard deviations of adipose tissue CT numbers in axial slices of medium (a) and large size (b) specimens. Values are plotted as a function of position along the axial direction.