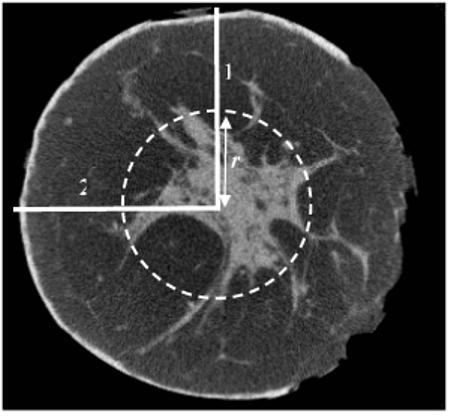
Figure 3.

An axial view of the breast mastectomy specimen CBCT image. Two lines represent the radial profiles of the image at θ equal to 90 (1) and 180 (2). The intersection points of the circle and the radial profiles show two sample locations at a distance r from the origin.
