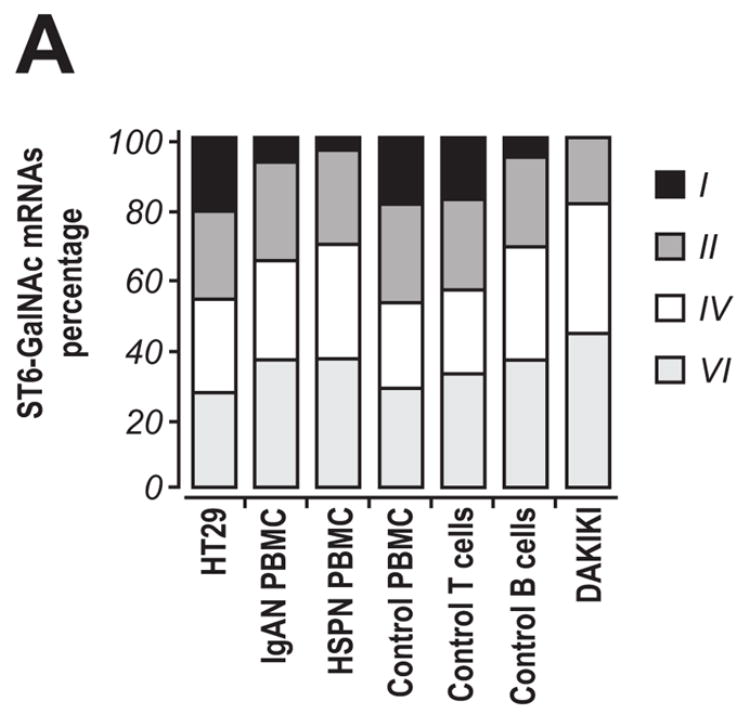
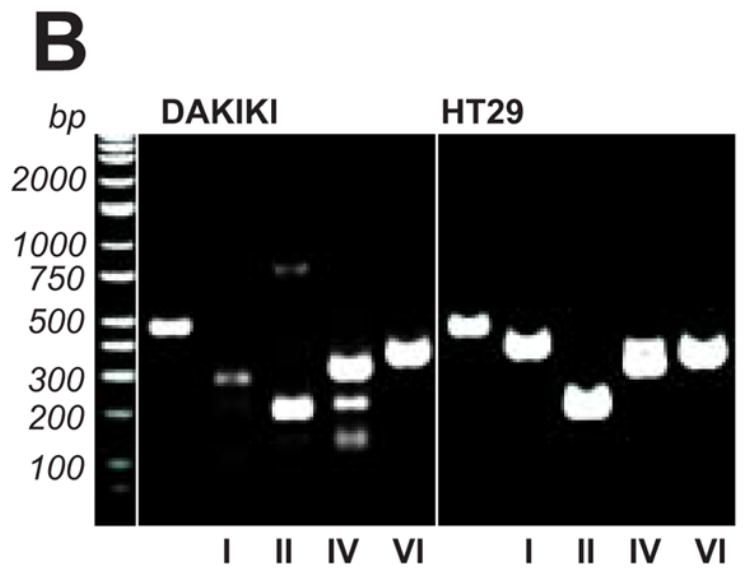
Figure 3. Transcription of ST6-GalNAc genes in human cells.


RNA samples from DAKIKI cells were analyzed for transcription of ST6-GalNAc genes. HT29 cells were used as a control and PBMC from patients with IgAN or HSPN, and from a healthy control were also analyzed. In addition, T and B cells isolated by FACS from PBMC of a healthy control were also included. A, The distribution of ST6-GalNAcI, ST6-GalNAcII, ST6-GalNAcIV, and ST6-GalNAcVI mRNA levels detected by RealTime RT-PCR; B, final products of RealTime RT-PCR (total 42 cycles) from DAKIKI cells and HT29 cells, analyzed on 1% TAE agarose gel to confirm specificity of the reactions. Primers used in the reactions (from left to right): β-actin, ST6-GalNAcI, ST6-GalNAcII, ST6-GalNAcIV, and ST6-GalNAcVI.
