
Figure 4. ST6-GalNAcI and ST6-GalNAcII transcription activity in B- and T-cell enriched PBMC.
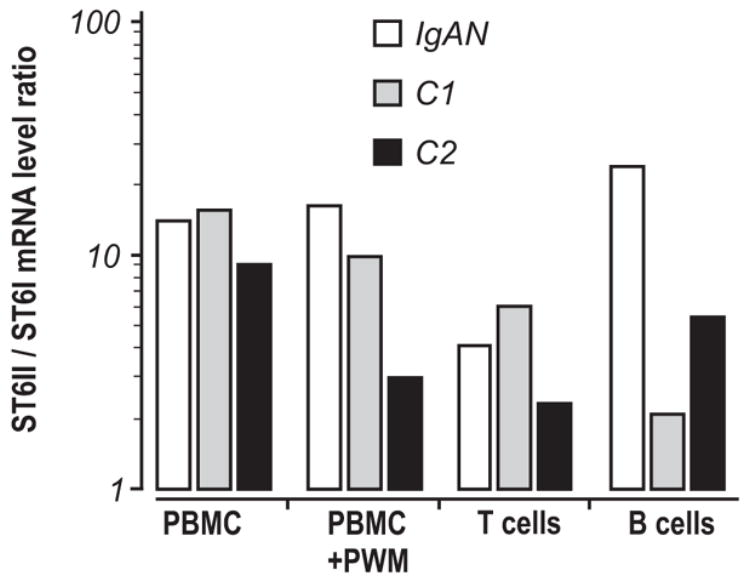
RNA was isolated from PBMC, PWM-stimulated PBMC (PBMC+PWM), a T-cell fraction and an enriched B-cell population from an IgAN patient (IgAN) and two healthy controls (C1 and C2). mRNA levels of specific transcripts were determined by RealTime RT-PCR and ratios of estimated crossing points ST6-GalNAcII / ST6-GalNAcI were calculated.