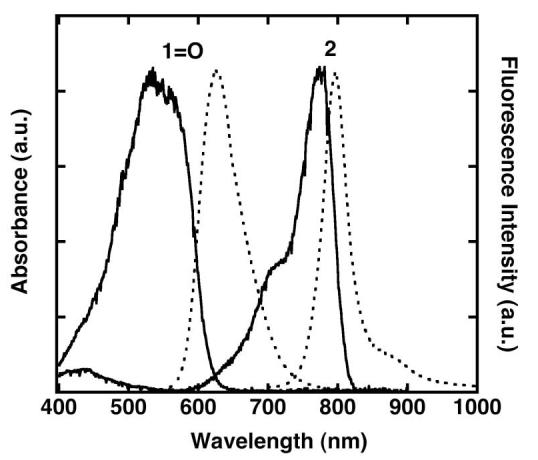
Figure 1.

Normalized absorption (solid line) and emission spectra (dotted line) of compounds 1=O, and 2 in MeOH. Dye 1=O was excited at 530 nm. (γmax, abs = 535 nm, γmax, em = 625 nm). Probe 2 was excited at 770 nm. (γmax, abs = 774 nm, γmax, em = 796 nm).
