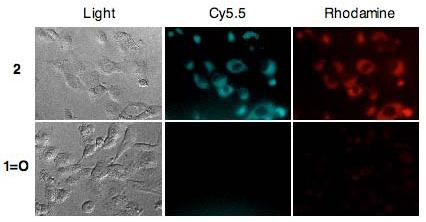
Figure 5.

Fluorescence microscopy images of BT-20 cells incubated with 10 μM of probe 2 (top) or 1=O (bottom) for 30 min at 37 °C. Left: Transmitted light images of the cells. Middle: Fluorescence images of the cells monitored with Cy5.5 filters (Filters: Ex = 670/20 nm, Em = 700LP) representing permeated probe 2. Right: Fluorescence image of the cells monitored with rhodamine channel (Filters: Ex = 550/30 nm, Em = 615/45 nm) representing deacetylated dye 1=O.18
