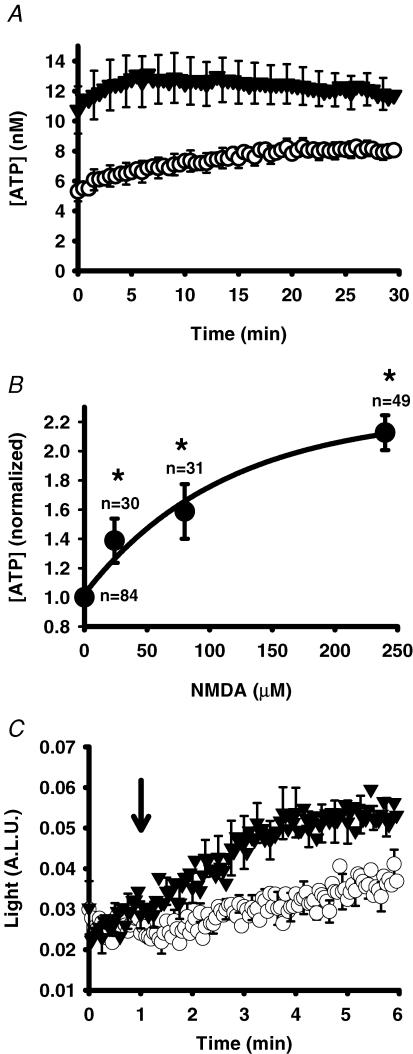
Figure 3. NMDA triggers release of ATP from ARPE-19 cells.
A, mean traces from representative experiments showing the time-dependent changes in ATP levels surrounding ARPE-19 cells following addition of NMDA (240 μm, ▾) versus control cells (○). Recording began 3–5 min after addition of drugs to cells. Symbols represent the means ± s.e.m. (n = 49). B, increasing concentrations of NMDA produced increasing levels of ATP bathing ARPE-19 cells. Levels of ATP were determined from the area under the curve for the 30 min duration of experiments like those illustrated in A and normalized to the mean control level for each day. The symbols represent the means ± s.e.m.*P < 0.05 versus control value. The line is a fit of the single exponential rise y = y0+a(1 − e−bx) with y0 = 1.02, b = 0.009 and a = 1.24. C, ATP was rapidly detected by injecting either control medium (○) or NMDA (working strength 300 μm, ▾) into each well as indicated by the arrow, and recording at 1 Hz. Increased levels of ATP were first detected within 30 s of the NMDA injection (n = 8). A.L.U., arbitrary light units.

