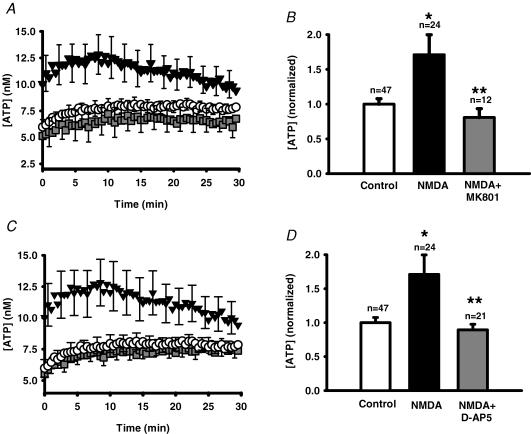
Figure 4. NMDA receptor antagonists block the NMDA-stimulated ATP release.
A, mean traces from representative experiments showing the ATP release from ARPE-19 cultured cells stimulated by 240 μm NMDA (▾) versus control cells (○). Inclusion of the NMDA receptor blocker MK-801 (24 μm,  ) blocked NMDA-stimulated ATP release. Cells were pre-incubated with 30 μm MK-801 for 30 min before recording began. Symbols represent the means ± s.e.m., n = 16. B, quantification of the total amount of ATP in the bath over the 30 min record indicated that MK-801 (24 μm, grey bar) significantly inhibited the NMDA-stimulated ATP release (240 μm NMDA, filled bar, NMDA alone). *P < 0.05 versus control (open bar); **P < 0.05 versus NMDA alone; MK-801 + NMDA not significantly different from control value. Bars indicate means +s.e.m.C, mean traces from representative experiments showing the effect of a second NMDA receptor antagonist, d-AP5 (80 μm,
  ), on the ATP release triggered by 240 μm NMDA (▾). Cells in control solution are indicated by ○; n = 16. Cells were pre-incubated in 100 μmd-AP5 for 30 min before recording began. D, quantification of the ATP released over 30 min indicates that while 240 μm NMDA (filled bar) significantly increased ATP release over control levels (open bar), co-incubation with 80 μmd-AP5 (grey bar) blocked this release. *P < 0.05 versus control (open bar); **P < 0.05 versus NMDA alone; d-AP5 + NMDA not significantly different from control value.

