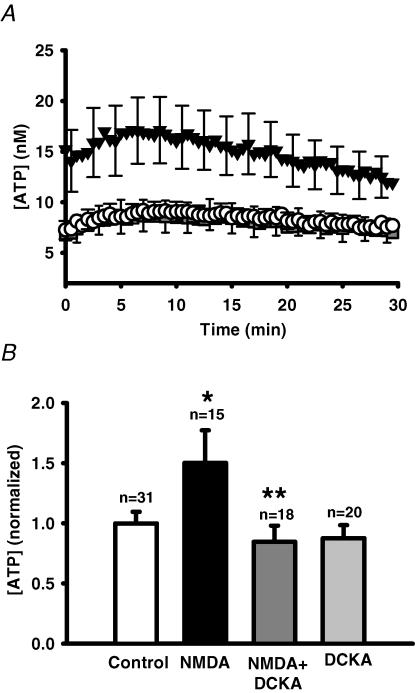
Figure 5. Block of NMDAR glycineB sites with DCKA prevents NMDA-stimulated ATP release.
A, mean traces from representative experiments showing changes in ATP release from ARPE-19 cultured cells stimulated by 300 μm NMDA (▾) versus control cells (○). The glycineB site antagonist DCKA (24 μm) blocked NMDA-stimulated ATP release ( ). Data points show the means ± s.e.m. In all cases, growth medium contained 250 μm glycine. Cells were pre-incubated with 30 μm DCKA for 30 min before recording began. B, quantification of the total ATP released over 30 min indicates DCKA (24–30 μm, dark grey bar) produced a significant inhibition of the NMDA-stimulated ATP release (filled bar). The addition of DCKA alone (30 μm, light grey bar) did not significantly change ATP levels. *P < 0.05 versus control value (white bar); **P < 0.05 versus NMDA alone.

