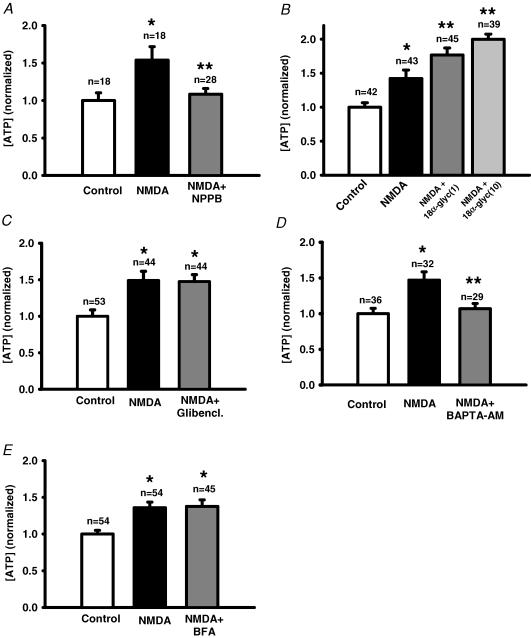
Figure 8. Mechanisms for ATP release.
A, the channel blocker NPPB (30 μm, grey bar) inhibited the NMDA-stimulated ATP release (240 μm; filled bar). Here and throughout the figure, *P < 0.05 versus control value; **P < 0.05 versus NMDA, and control value is indicated by an open bar. In A, NPPB + NMDA were not significantly different from control value. B, the gap/hemichannel blocker 18αGA (1 and 10 μm; grey bars) increased ATP levels compared with NMDA alone (240 mm; filled bar). This response did not result from a non-specific interaction with the luciferase assay (Fig. 1). C, the CFTR blocker glibenclamide (80 μm, Glibencl.; grey bar) did not inhibit the NMDA-stimulated ATP release (240 μm; filled bar). D, clamping intracellular Ca2+ with the chelator BAPTA AM (16 μm, grey bar) completely blocked the NMDA-stimulated ATP release (filled bar). E, ATP release triggered by 240 μm NMDA (filled bar) was not significantly altered by treatment with BFA (8 μg ml−1, grey bar).

