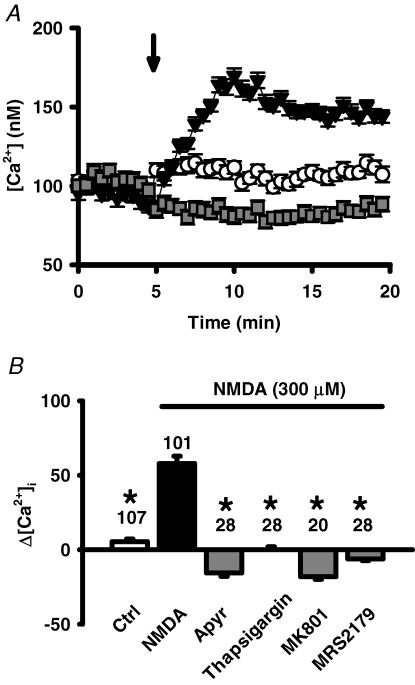
Figure 9. NMDA-triggered release of ATP raises Ca2+.
A, the co-application (▾) of NMDA (300 μm) and glycine (250 μm, arrow), increased intracellular Ca2+ from baseline levels when compared to addition of control solution (○). This increase was prevented by the ecto-ATPase apyrase (1 U ml−1,  ). Symbols represent the means ± s.e.m., n = 20–28. Cells were pre-incubated with 1 U ml−1 apyrase for 30 min before recording began. B, quantification of the increase in Ca2+ peak levels, expressed as percentage increase over pre-addition levels. Calcium levels 5 min after addition of control solution or NMDA or NMDA + drug were compared to mean basal levels before application, using the protocol illustrated in A. While NMDA + glycine (filled bar) significantly increased Ca2+ levels over control levels (open bar), the presence of with 1 U ml−1 apyrase, 1 μm thapsigargin, 30 μm MK-801 and 100 μm MRS2179 (grey bars) all blocked this increase. *P < 0.05 versus NMDA alone.

