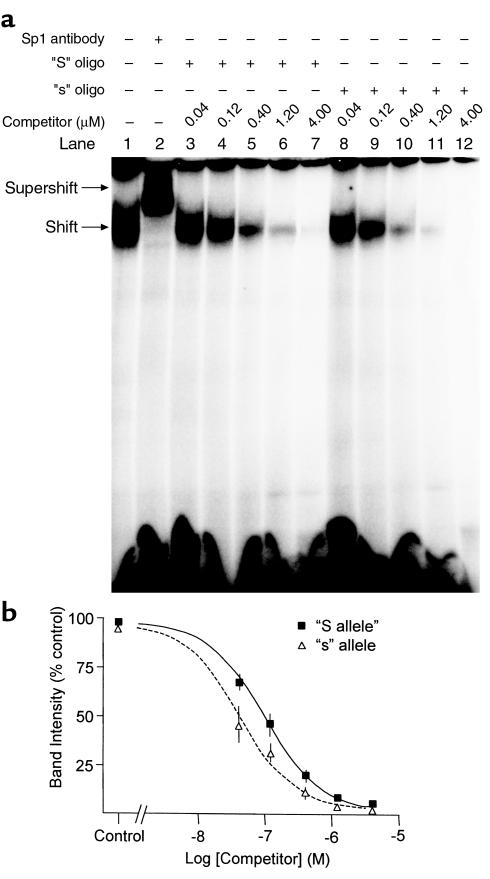
Figure 2.
(a) Typical gel shift assay with 32P-labeled “S” oligonucleotide and hrSp1 protein (all lanes), illustrating the DNA-Sp1 complex (shift) and the supershifted complex (supershift) created by incubating the hrSp1 with Sp1 antibody (lane 2). The shift is attenuated more rapidly with increasing concentrations of the unlabeled “s” oligonucleotide (lanes 8–12) compared with the unlabeled “S” oligonucleotide (lanes 3–7). (b) Analysis of Sp1 binding affinity. Band intensity of the shift in lanes containing competitor oligonucleotides was expressed as a percentage of the band intensity in the absence of competitor (control, lane 1) and analyzed by GraphPad Prism. Data points are means ± SEM from three experiments.

