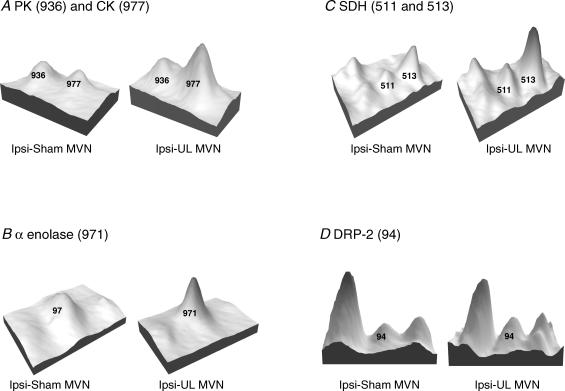
Figure 3. Examples of protein spots in selected individual gels from ipsi-sham MVN and ipsi-unilateral labyrinthectomy (UL) MVN.
Spots are represented as three-dimensional peaks derived from their optical density profiles in the gel image (using a standard feature of the Phoretix 2005 software). In each case the numbered peaks are those which showed significant changes after UL, and the identity of the protein content is indicated. The peaks without numbers (e.g. to the left of spot 511 in C, and to the left and right of spot 94 in D) were analysed by the software but they were not selected for protein identification because they did not show significant changes in normalized volume after sham surgery or UL (see Methods). A, pantothenate kinase (PK, spot 936) showed a small reduction in level in the ipsi-UL MVN, while creatine kinase (CK, spot 977) was increased. The mean normalized volume of PK across all the gels showed a decrease of 44% (ipsi-UL versus ipsi-sham MVN, Table 1) while mean normalized volume of CK increased by 138%. B, α-enolase (spot 971) was increased in the ipsi-UL gel; on average across gels α-enolase increased by 110%. C, succinate dehydrogenase was found in two closely spaced spots, 511 and 513. Both spots were increased in the ipsi-UL gel; on average across gels these spots increased by 271 and 210%, respectively. D, dihydropyriminidase-related protein 2 (spot 94) is increased in the ipsi-UL gel; on average across gels this spot increased by 130%.

