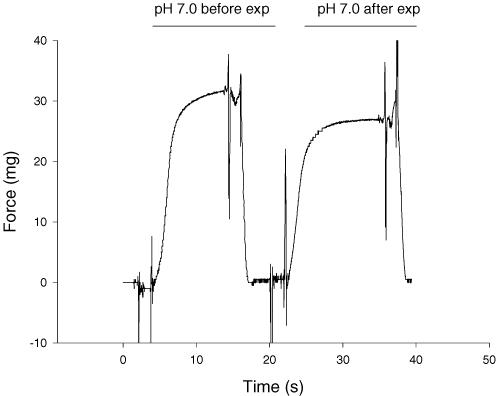
Figure 2. Force traces for a slow type I fibre.
The left trace is a force recording at the beginning of the experiment (exp) under control conditions (pH 7.0 and 15°C), while the right trace is under the same conditions but following the 30°C experiments carried out at pH 6.2 and 7.0. This representative fibre had maintained 93% of its initial peak force (P0). The large deflections at the beginning and end of each force record are artifacts caused during movement of the fibre between the relaxing and activating solutions.

