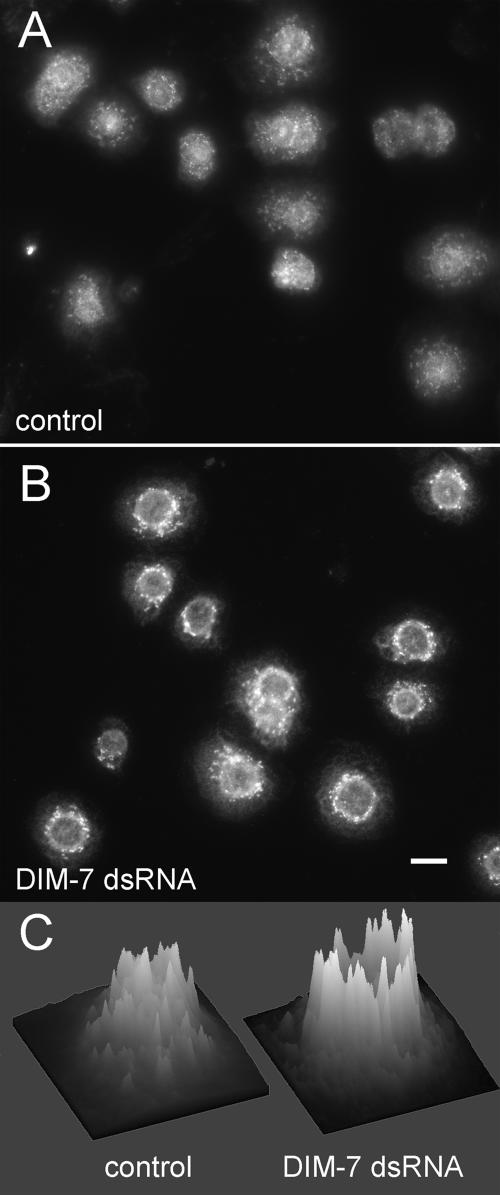
Figure 3.
Distribution of total ERK in integrin-expressing, spreading S2 cells changes after DIM-7 reduction. αPS2βPS integrin-transfected cells were stained for total ERK (compared with dpERK staining in similarly treated cells in Figure 1). Cells in A were treated with only control dsRNA against endogenous βPS; cells in B were also grown in dsRNA targeting DIM-7. Most cytoplasmic ERK is present in aggregates. On reduction of DIM-7, the aggregates are brighter and concentrated around the nucleus, often creating a bright perinuclear ring. This is especially evident in intensity plots of individual cells, as illustrated in C. Similar plots for 8 cells from each panel can be found in the Supplemental Figure 6. Bar, 10 μm.

