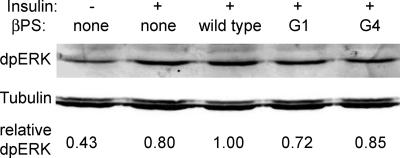
Figure 5.
Total phospho-ERK levels are similar in integrin mutants. Western blot showing levels of total dpERK 20 min after insulin stimulation (except lane 1) in cells expressing wild-type or mutant forms of βPS. Loading control is the same blot probed with antibodies against β-tubulin. As indicated by the quantitation below the bands (which reflects a ratio of dpERK to tubulin), dpERK is sometimes reduced in integrin mutants relative to cells expressing wild-type integrins, but integrin mutations are never seen to reduce total dpERK levels similarly to the reduction in nuclear dpERK at the same time point (Figure 4).

