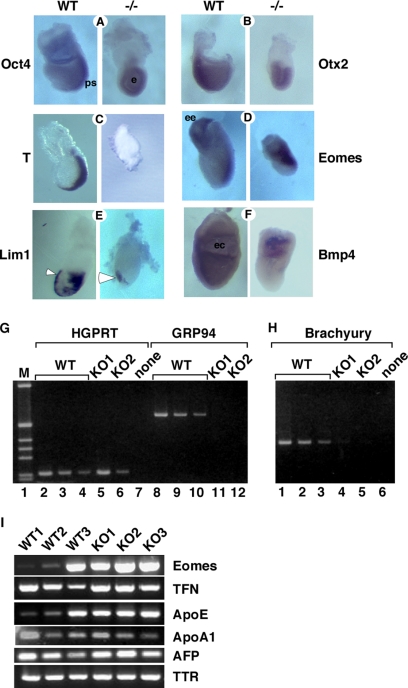
Figure 3.
Grp94−/− embryos do not express mesodermal markers. (A–G) Analysis of developmental markers in grp94 mutant embryos by whole mount in situ hybridization. In all pairs, the WT embryo is on the left, and the mutant embryo is on the right. All embryos are E7.5 except where noted. Representative mutant and WT embryos out of 2–7 litters analyzed for each marker are shown. (A) Oct4 is normally expressed throughout the epiblast at E6.5 and is later progressively localized to the primitive streak (ps) at E7.5 in WT embryos. Mutants show sustained overall epiblast (e) expression. (B) Otx2 expression at E7.5 is localized to the anterior region of normal embryos, but is expressed in the entire epiblast of the mutant. (C) Brachyury is expressed in the primitive streak at E7.5 in normal embryos, but is not detectable in E7.5 mutant embryos. (D) Eomes is expressed in WT embryos in the extraembryonic ectoderm (ee) and developing primitive streak. Expression in mutant embryos at E7.5 (shown) resemble WT embryos at E6.5 (not shown). (E) Lim1 is expressed in the AVE (arrowhead) as well as in the primitive streak and node of WT E7.5 embryos, but in mutant embryos, primitive streak expression is absent. (F) Bmp4 expression is detected at E7.5 in the extraembryonic mesoderm lining the exocoelomic cavity (ec) of WT embryos. Mutant embryos express Bmp4 only in the proximal extraembryonic ectoderm. (G–I) Analysis of gene expression by RT-PCR. (G) cDNA was prepared from whole E7.5 embryos carefully dissected away from maternal tissue. One wild-type (WT) and two grp94−/− embryos (KO1 and KO2) are shown. The amount of input cDNA was normalized using HPRT primers in the linear range of the PCR reaction (lanes 1–6). WT cDNA, at 0.25 μl (lanes 2 and 8), 0.125 μl (lanes 3 and 9), and 0.063 μl (lanes 4 and 10) are shown. Lanes 5–6, grp94−/− cDNA, at 11–12: 1.5 μl, from two separate −/− embryos (KO1 and KO2, respectively). The primers for GRP94 amplification span the Neo insertion site and therefore, if there is amplification of KO cDNA, the product is too large to be resolved by the gel. (H) The same cDNAs as in G were used to estimate the expression of brachyury, the canonical early mesoderm marker. Adjusting for the differences of input cDNA, the signal from KO1 is about four times greater than the signal from KO2, but two orders of magnitude weaker than that from WT cDNA. One of four experiments is shown. (I) RT-PCR analysis of expression of mesodermal and VE markers. cDNAs from 3 WT and 3 KO embryos were compared, normalized according to β-tubulin expression. Eomes, the T-box transcription factor eomesodermin. Its expression varies among the three WT embryos likely because WT1–3 were in decreasing age order between E6.5 and E7.5. The VE markers tested were as follows: TFN, transferrin; ApoE, apolipoprotein E; ApoA1, apolipoprotein A1; AFP, α-fetoprotein; TTR, transthyretin.

