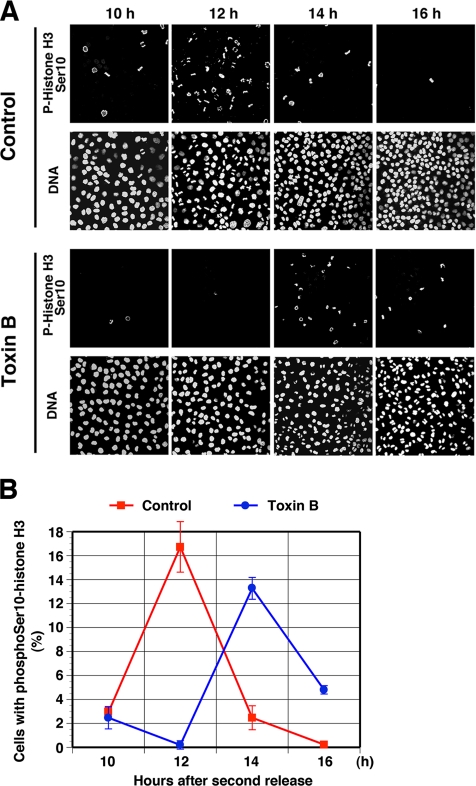
Figure 3.
(A) Mitotic entry delay by toxin B treatment. HeLa cells were fixed at indicated times after the second release and stained for phosphoSer10-hisotne H3 and DNA. Note that Ser10-histone H3 phosphorylation appears 14 h after the second release in the toxin B–treated cells with concomitant appearance of mitotic figures. Sustained mitotic figures in the toxin B–treated cell population at 16 h is due to mitotic arrest induced by this toxin (Yasuda et al., 2004). Typical results of three independent experiments are shown. (B) Quantitative analysis. The number of cells positive for phosphoSer10-histone H3 was determined in 300 cells of each population at each time and is presented as %. Data are mean ± SEM (n = 3).

