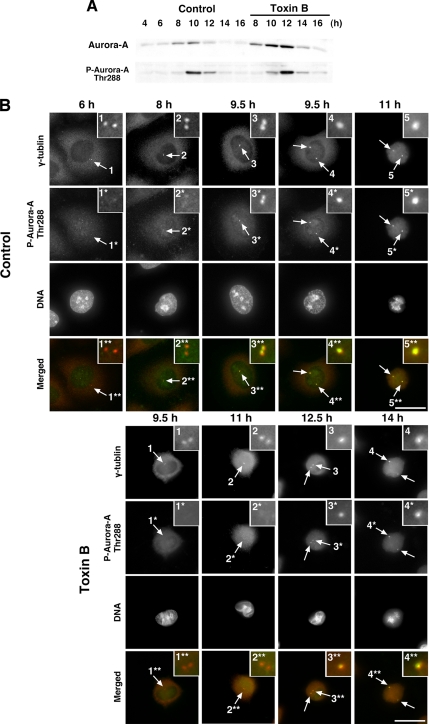
Figure 5.
Aurora-A expression and activation at the centrosome in toxin B–treated cells. (A) Immunoblot analysis for Aurora-A and phosphoThr288-Aurora-A. HeLa cells were collected at indicated times after the second release with addition of toxin B at 8 h. Cell lysates were prepared and subjected to immunoblot as indicated. (B) Immunofluorescence for phosphoThr288-Aurora-A in control and toxin B–treated cells. HeLa cells were fixed at indicated times after the second release and stained for γ-tubulin (red), phosphoThr288-Aurora-A (green), and DNA. Insets show magnified views of the centrosome indicated by numbered arrows. (Note that Aurora-A activation examined as phosphoThr288-Aurora-A appeared 9.5 h after the release in control cells, whereas it became evident 12.5 h in toxin B–treated cells.) Typical results of at least three independent experiments are shown. Bar, 10 μm.

