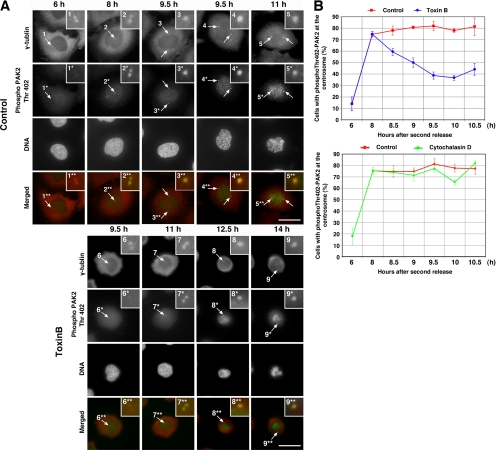
Figure 8.
Inhibition of PAK activation at the centrosome by toxin B treatment. (A) Immunofluorescence for phosphoThr402-PAK2. HeLa cells were fixed at indicated times after the second release and stained for γ-tubulin (red), phosphoThr402-PAK2 (green), and DNA. Insets show magnified views of the centrosome indicated by numbered arrows. Note that PAK activation examined as phosphoThr402-PAK2 present 8 h after the release was abolished at 9.5 h in toxin B–treated cells. The phosphoThr402-PAK2 signals on chromosomes of mitotic cells may represent PAK activation at kinetochores (Li et al., 2002). Typical results of at least three independent experiments are shown. Bar, 10 μm. (B) Quantitative analysis on PAK activation. HeLa cells treated with either toxin B (top) or cytochalasin D (bottom) were fixed at indicated times after the second release and stained for γ-tubulin and phosphoThr402-PAK2. The number of cells with a signal of phosphoThr402-PAK2 at the centrosome was determined in 50 cells of each population. Data are mean ± SEM (n = 3).

