Figure 6.
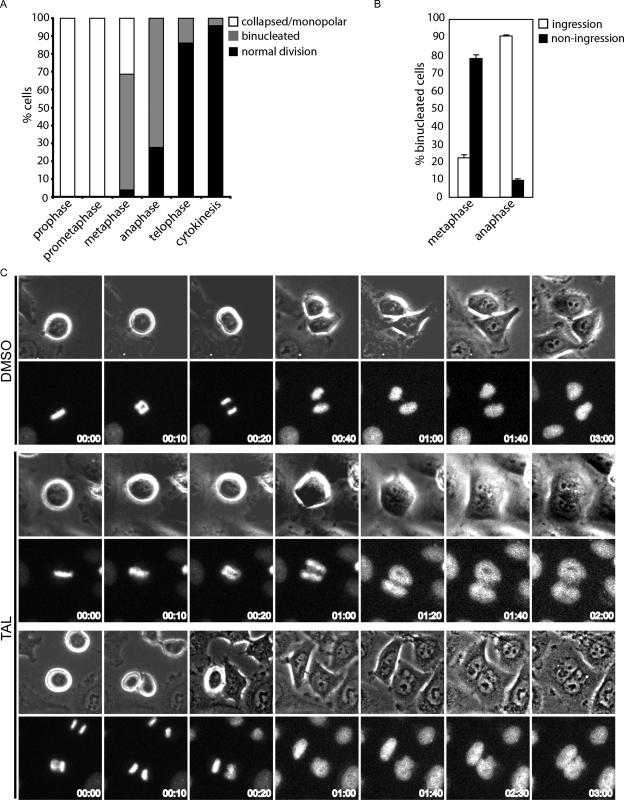
Plk1 activity is required for successful cytokinesis. (A) Quantification of the percentage of cells in different stages of mitosis that upon TAL treatment collapsed into monopolar spindles or went through mitosis completing normal division or failing in cytokinesis. Approximately 100 cells were counted in two independent experiments performed by live-cell imaging. (B) The failure in cytokinesis with or without furrow ingression was analyzed and plotted for the cells in metaphase or anaphase from the previous experiment. (C) Representative stills from these movies are shown. Time = 0 represents the stage in mitosis at the time of addition of the inhibitor. Top panels, a control cell that progress normally through mitosis (DMSO); bottom panels, cells that fail in cytokinesis with or without furrow formation and ingression (TAL panels, upper two rows and lower two rows, respectively).

