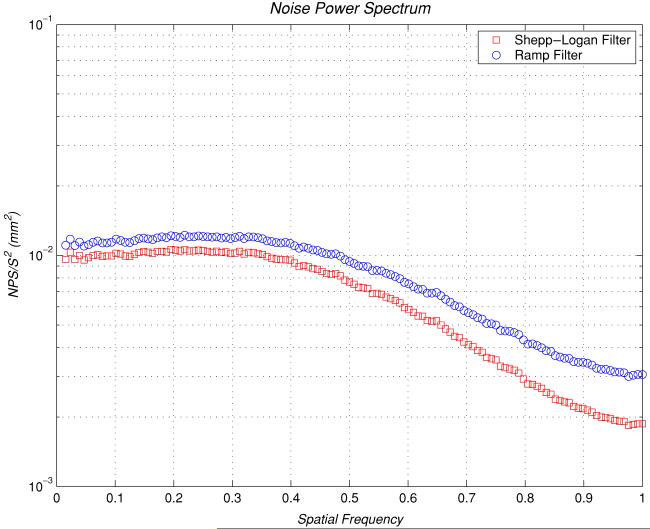
Figure 5.
Computed NPS for the image reconstructed at the mid x–y plane where z = 0. Two curves (one for the Shepp–Logan filter and one for the Ramp filter) are compared. Note that the spatial frequency on the x-axis has been rescaled to where the Nyquist frequency is 1.0 and the y-axis is in logarithmic scale.

