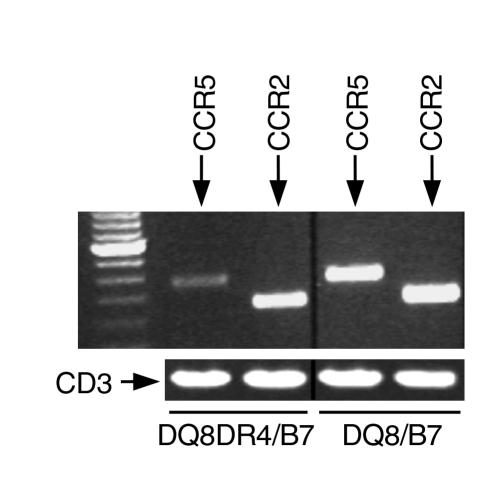
Figure 7.
The mRNA expression of chemokines CCR5 and CCR2. Expression of chemokines CCR5 and CCR2 mRNA was assessed using RT-PCR (see Methods), as shown in the ethidium-bromide stained gel. CD3ε was used as the internal control for the normalization of RNA levels of tested samples, as indicated. Lane 1: 100-bp ladder; lanes 2–5: CCR5 or CCR2, as shown. RT-PCR was performed on oligo-dT–synthesized cDNA, which was derived from total RNA of anti-CD3–stimulated T cells from spleens of nondiabetic mice as indicated.

