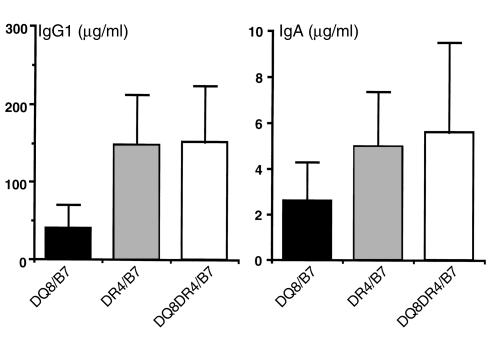
Figure 8.
Expression of Ig isotypes in DQ8+/mII–/RIP-B7, DR4+/mII–/RIP-B7, and DQ8+DR4+/mII–/RIP-B7 mice. Serum levels of IgG1 and IgA were measured using ELISA (see Methods) in the three groups of mice as indicated. The number of mice in each group was 15, 20, and 22 for DQ8+/mII–/RIP-B7, DR4+/mII–/RIP-B7, and DQ8+DR4+/mII–/RIP-B7 mice, respectively. The results are presented as mean ± SD. Student’s t test was used for the statistical analysis.

